This time of year, everyone in the United States is starting to fill out—with varying levels of enthusiasm—our federal income tax forms. Yet, after we write our checks to the IRS, most of us don’t really know exactly where our money is going.
Fortunately, there’s a new online tool to help us find out. Last year, Andrew Johnson and Louis Garcia, two developers from Minneapolis, Minn., created a website called whatwepayfor.com that uses public data to estimate how our tax money is spent. You enter your income and filing status on the site, and it creates a formatted table of numbers showing your contributions to the federal budget—down to the penny:

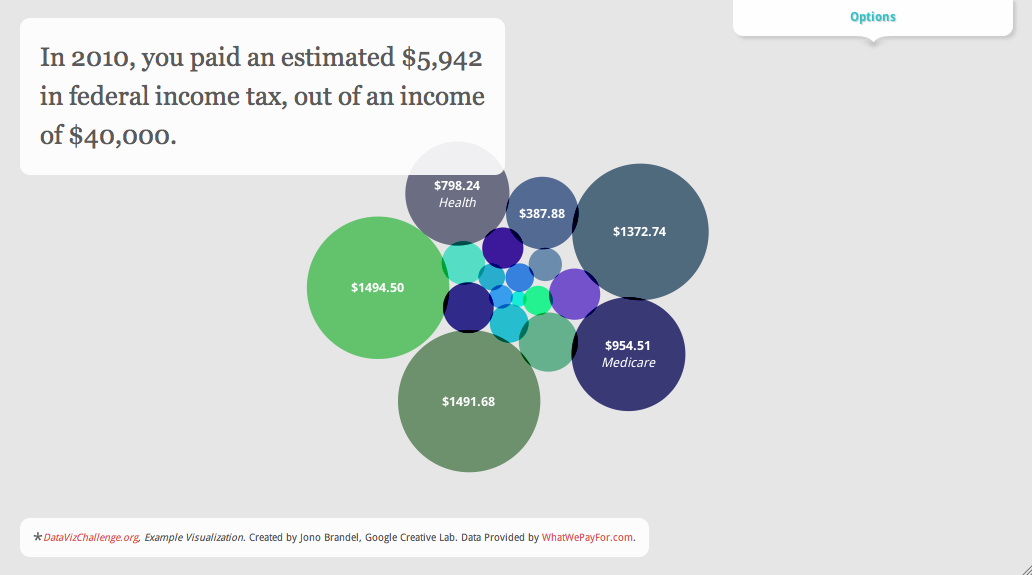
We’re impressed by what the website uncovers. In 2010, for example, a married couple making $40,000 a year contributed approximately $14.07 to space operations, $6.83 to aviation security and $0.91 to the Peace Corps…and those are just a few of the hundreds of expenditures revealed on the site. As we spent time exploring all of these details, it got us thinking: how we could make the information even more accessible? So we created a simple interactive data visualization:
Click the image above to try the interactive version—it lets you drag the bubbles around, change the income level and so on. You can now look at the data in a new way, and it’s a little more fun to explore. Of course, there are lots of ways to visualize the data, and we’re very sure there are many talented designers and developers around the country who can do it even better than we have.
To make that happen, we’ve teamed up with Eyebeam, a not-for-profit art and technology center, to host what we’re calling the Data Viz Challenge. Andrew and Louis have built an API to let anyone access the data, so now you can choose how to display it. Could you create a better animated chart? Something in 3D? An interactive website? A physical display somewhere in the real world? We want you to show everyone how data visualization can be a powerful tool for turning information into understanding.
You can enter the challenge at datavizchallenge.org, where you’ll also find more information about challenge and the data. The challenge starts today and ends March 27, 2011, and is open to the U.S. only. The top visualization, as chosen by a jury, will receive a $5,000 award and a shout-out on the site and this blog. We’ll announce the shortlist on the week of April 11, and the winners on April 18, a.k.a. Tax Day.
If you’re a data viz enthusiast, we hope you’ll take a look at the data and build your own creative visualization. But even if you’re not, hopefully the results will help you appreciate what data visualization can do, and its usefulness in turning raw information—like federal income tax numbers—into something you can explore and understand.
 First Place: Luke Holdmann, Milwaukee, USA
 Second Place: Abedallah, Christchurch, New Zealand
 Third Place: Zoungy, USA