Google Maps Mashups 16

They Draw & Travel – World Map

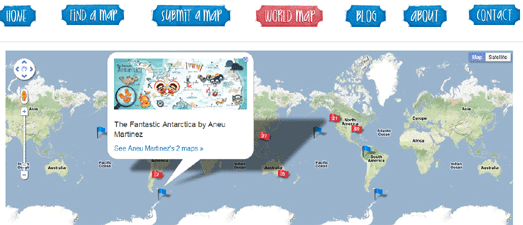
They Draw & Travel is a collection of wonderful user submitted hand drawn maps.

The World Map lets you browse the maps submitted to They Draw & Travel on Google Maps. You can click on any of the map markers and view the hand drawn map submitted for that location.

One Day on Earth

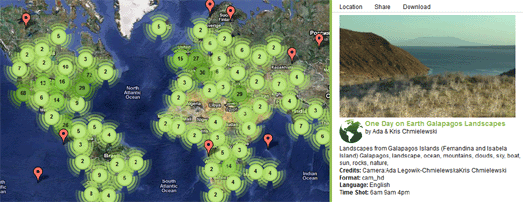
On 10.10.10 One Day on Earth asked people around the world to create a video of their world. The goal of the project was to “create an open shareable archive and documentary film of the world on 10/10/10.”

You can browse and watch the thousands of videos that were contributed around the world on this Google Map.

#rorschmap

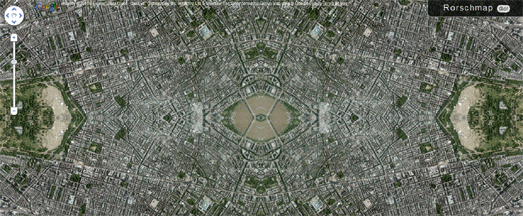
I only found this map yesterday and it has already become a firm favourite.

#rorschmap uses the Google Maps API to create a kaleidoscope for any location on the Earth. Essentially the application displays the Google Maps satellite view of a location and, using the same principle of multiple reflection that you find in kaleidoscopes, creates an animated Rorschach test effect.

Great British Picnics


The Guardian newspaper is increasingly working with partners to produce useful Google Map based guides. The newspaper are collaborating with lastminute.com to create their City Guides. They have also worked with Enjoy England to create a Google Map based guide to great destinations in the UK.

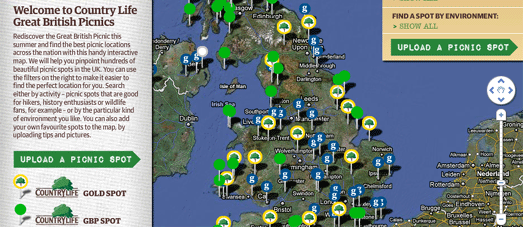
The Guardian has now partnered with Country Life Butter to create a Google Maps guide to great picnic spots in the UK.

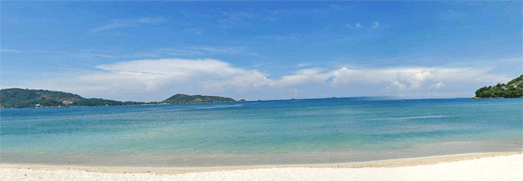
The map helps you search for a picnic spot by activity, for example spots that are good for hikers, photographers or wildlife fans. You can also search by environment, such as by beach, riverside or country park.

If you have a favourite picnic spot of your own you can add it to the map.

Maersk Fleet – Live Map


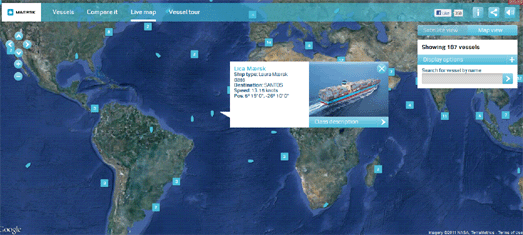
This Google Map allows you to track in real-time the the huge shipping containers of Maersk as they travel around the world.

The position of the ships are displayed live on this Google Map. You can click on any of the ship map markers to view a photograph of the ship and read further details, such as the ship’s destination and current speed.

This map presumably uses the Automatic Identification System (AIS), an automated tracking system used on ships to plot real-time positions.

Integrate Google Maps and Flickr into a Real-Time App


.net magazine has published a great tutorial on how to create a real-time animated Flickr map. The tutorial was written by James Christian and Ben Gannaway the creators of the excellent Net-a-Porter Live Google Map.

The tutorial explains how to create a Google Map that animates in near real-time through images posted on Flickr. The tutorial includes how to work with the Flickr API and how to customise the look of your map.

Alongside the tutorial is a demo map and a link to download the full source code.

Rendezview


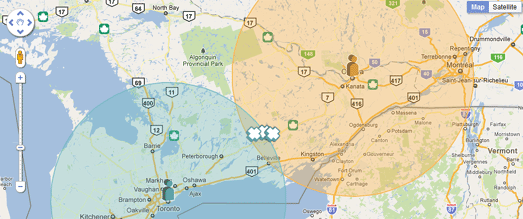
Yellow Pages in Canada has released a useful application to help two or more people find the best place to meet.

To find a place to meet you need to enter your address and the address of the person you plan to meet. You can then select the type of venue where you wish to meet, for example a restaurant, a bar or a cafe.

Rendezview will then create a Google Map showing you the most convenient venues that you could meet (based on your selected preferences), roughly half-way between the two locations.

Japanese Castle Explorer


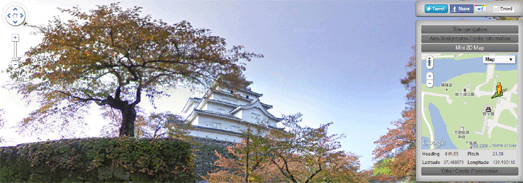
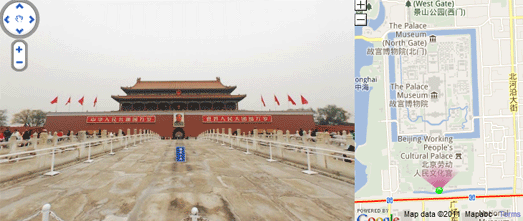
Daniel O’Grady’s excellent Japanese Castle Explorer has been updated to take advantage of all the new wonderful Street View imagery available for Japan.

This year the Street View trike has been very busy in Japan capturing a lot of beautiful new off-road imagery, particular in the grounds of some of Japan’s castles.

The Japanese Castle Explorer is a great map that shows the locations of Japan’s most famous (and plenty of lesser known) castles. The map allows you to view Japan’s castles in Google Maps satellite view. Now it is also possible, where available, to view the castles in Street View.

The map is available in English and Japanese versions. You can view an example of the Street View at Himeji Castle (use the link to ‘Other Castle Panoramas’ in the sidebar to navigate to view other castles in Street View).

The Bath Schools Map


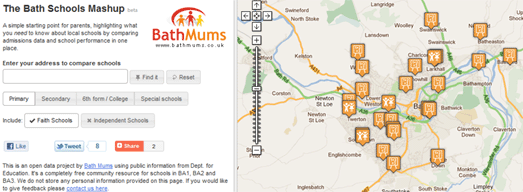
The Bath Schools Map is designed to help parents choosing schools in Bath, in the UK, by displaying local schools and admissions and performance data on Google Maps.

In Bath parents are only allowed to indicate 3 schools as a preference for their children. Using the map it is possible to find the nearest ten schools and compare their academic mini-league tables on a range of metrics with a sidebar. This helps parents make school choices from a broad base of information rather than gearing towards a single metric.

GeoBus
Geobus is a nice little app that can find the nearest bus-stops for any location in the UK. Just enter a postcode or use the ‘locate me’ button and the nearest bus-stops to your current location will be displayed on a Google Map.

The application was developed as part of the recent Young Rewired State initiative.

England’s Health Data Map


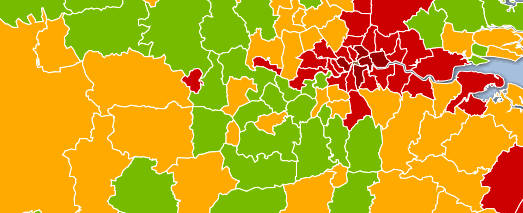
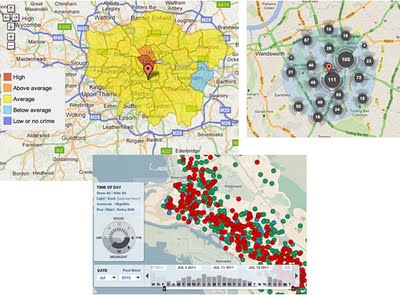
The Guardian has used Fusion Tables to map the latest Health Profiles data from the Department of Health and the Public Health Observatories.

Using the Google Map it is possible to compare a number of health indicators for regions in the UK. For example, it is possible to view child obesity throughout the UK or view where the most people die from smoking.

There are still quite a lot of gaps in Street View’s coverage around the world. Luckily a number of other providers have created their own Google Maps based Street View applications to try and plug these gaps.

China – with City8


In China City8 have created extensive interactive 360 degree panoramas in 45 of the country’s biggest cities.

MapJack


As well as providing Street View type imagery in the USA, Canada, Singapore and Sweden Mapjack has also ventured where Google Street View has so far feared to tread. MapJack has great coverage in Malaysia, Thailand and Puerto Rico.

Norc


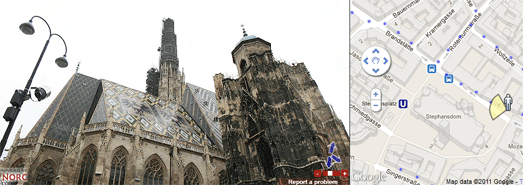
Norc has great coverage in central and eastern Europe, including in Poland and Austria, where Google’s Street View cars have yet to drive.

via:goglemapsmania

3 Crime Maps: Point collation


Quick update of the Placemark Clustering project: we’ll be doing user tests using the uk police crime map later this summer (discussed below) comparing it to a chloropleth grid (translation = head map based on grid, I explain further here)
In thinking about this I’ve hunted down some examples and I thought it would be interesting to name check 3.


No Collation: The first map is Oakland Crime Spotting (bottom inset in figure) that is very similar to San Francisco Crime mapping, reviewed here. Unlike the other two maps it attempts no point collation at all, I image the authors would argue that they deal with the problem by providing sophisticated filtering tools to reduce the point density. However, it doesn’t help if the user wants to get an overview picture of crime across the area the map covers.
Traditional Choropleth: Switching to the the UK, the Metropolitan Police (=London for non UK readers) offer a choropleth map based on wards and subwards (top left insert). I regard this as the traditional approach. Notably it doesn’t show actual figures for postcodes, only sub wards – a sub ward is a collection of postcodes. My problem with this is that almost no one knows the boundaries of wards and sub wards so its a strange way to split the city up. (Aside: in my experience, Londoners tend to split London up based on tube stations)
Point Collation: The UK police offer a national map which uses point collation (top right insert). This is the main one we’re planning to test as IMHO it isn’t an effective way to visualise the data (related post). It offers a finer grain of data – you don’t actually see the true location of the crime but it is collated down to the postcode level. In London, a postcode is roughly equal to a single street.


Deleting Blank Tiles


Creating raster tilesets almost invariably leads to the creation of some blank tiles – covering those areas of space where no features were present in the underlying dataset. Depending on the image format you use for your tiles, and the method you used to create them, those “blank” tiles may be pure white, or some other solid colour, or they may have an alpha channel set to be fully transparent.

Here’s an example of a directory of tiles I just created. In this particular z/x directory, more than half the tiles are blank. Windows explorer shows them as black but that’s because it doesn’t process the alpha channel correctly. They are actually all 256px x 256px PNG images, filled with ARGB (0, 0, 0, 0):

image

What to do with these tiles? Well, there’s two schools of thought:

  • The first is that they should be retained. They are, after all, valid image files that can be retrieved and overlaid on the map. Although they aren’t visually perceptible, the very presence of the file demonstrates that the dataset was tested at this location, and confirms that no features exist there. This provides important metadata about the dataset in itself, and confirms the tile generation process was complete. The blank images themselves are generally small, and so storage is not generally an issue.
  • The opposing school of thought is that they should be deleted. It makes no sense to keep multiple copies of exactly the same, blank tile. If a request is received for a tile that is not present in the dataset, the assumption can be made that it contains no data, and a single, generic blank tile can be returned in all such instances – there is no benefit of returning the specific blank tile associated with that tile request. This not only reduces disk space on the tile server itself, but the client needs only cache a single blank tile that can be re-used in all cases where no data is present.

I can see arguments in favour of both sides. But, for my current project, disk and cache space is at a premium, so I decided I wanted to delete any blank tiles from my dataset. To determine which files were blank, I initially thought of testing the filesize of the image. However, even though I knew that every tile was of a fixed dimension (256px x 256px), an empty tile can still vary in filesize according to the compression algorithm used. Then I thought I could loop through each pixel in the image and use GetPixel() to retrieve the data to see whether the entire image was the same colour, but it turns out that GetPixel() is slooooowwwww….

The best solution I’ve found is to use an unsafe method, BitMap.LockBits to provide direct access to the pixel byte data of the image, and then read and compare the byte values directly. In my case, my image tiles are 32bit PNG files, which use 4 bytes per pixel (BGRA), and my “blank” tiles are completely transparent (Alpha channel = 0). Therefore, in my case I used the following function, which returns true if all the pixels in the image are completely transparent, or false otherwise:

public static Boolean IsEmpty(string imageFileName)
{
  using (Bitmap b = ReadFileAsImage(imageFileName))
  {
    System.Drawing.Imaging.BitmapData bmData = b.LockBits(new Rectangle(0, 0, b.Width, b.Height), System.Drawing.Imaging.ImageLockMode.ReadOnly, b.PixelFormat);
    unsafe
    {
      int PixelSize = 4; // Assume 4Bytes per pixel ARGB
      for (int y = 0; y < b.Height; y++)
      {
        byte* p = (byte*)bmData.Scan0 + (y * bmData.Stride);
        for (int x = 0; x < b.Width; x++)         {           byte blue = p[x * PixelSize]; // Blue value. Just in case needed later           byte green = p[x * PixelSize + 1]; // Green. Ditto           byte red = p[x * PixelSize + 2]; // Red. Ditto           byte alpha = p[x * PixelSize + 3];           if (alpha > 0) return false;
        }
      }
    }
    b.UnlockBits(bmData);
  }

  return true;
}


It needs to be compiled with the /unsafe option (well, it did say in the title that this post was dangerous!). Then, I just walked through the directory structure of my tile images, passing each file into this function and deleting those where IsEmpty() returned true.