The Red Sox vs Yankees Radio Rivalry Map
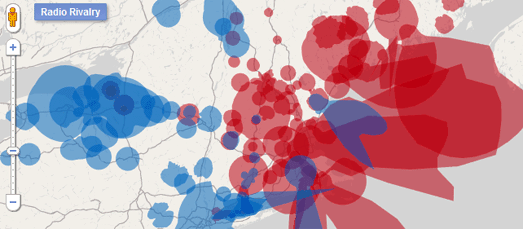
Tim Wallace used to face a huge problem every summer. When he was driving through Maine, New Hampshire or Vermont in the summer he knew a Red Sox game must be on a radio station nearby. His problem was trying to find which station was commentating on the game.
Thanks to the Google Maps API Tim has now solved this problem. His Google Map shows in red the areas where Red Sox games are available on the radio. What’s more you can click on any of the shaded areas and find out the name of the radio station and what frequency it broadcasts on.
Acutely aware of the endless suffering of less fortunate Yankees fans Tim has kindly added their radio coverage to the map as well.
Via: @geoparadigm
Griffith’s Valuation
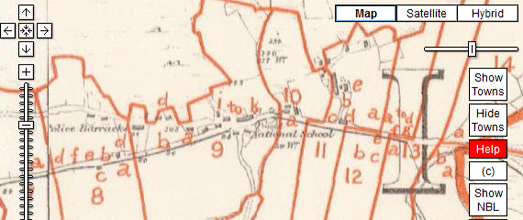
If you have Irish ancestors then Griffith’s Valuation might be able to help you search for an address or a particular person. This site from Ask About Ireland plots the Griffith’s Valuation on Google Maps.
Griffith’s Valuation was the first full-scale valuation of property in Ireland. It was published between 1847 and 1864 and is one of the most important genealogy sources surviving from 19th century Ireland.
To search the Griffith’s Valuation you can enter an ancestor’s name or a place. The results of your search are then displayed on a Google Map and in list form.
World Family Names
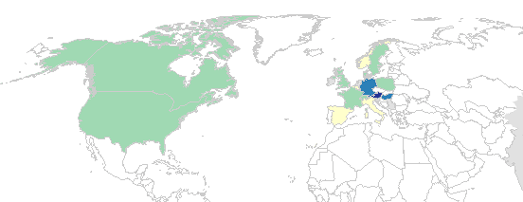
If you have nothing to go on but your surname, when searching your family tree, then you should start with Public Profiler’s World Family Names.
If you enter a surname into World Family Names you are presented with a heat map of the world showing where there are high concentrations of people with that name.
Beneath the map the top countries, regions and cities where your name occur are displayed in list form.
England Jurisdictions 1851
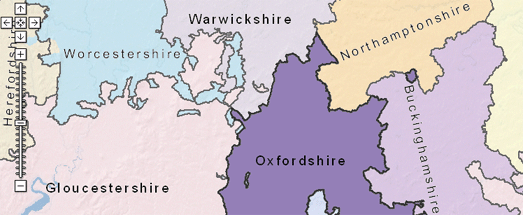
Genealogy website Family Search has created a nice Google Map that lets you search for places by county, parish, hundred and province in England, as they were constituted in 1851. The map should prove to be of great help for anyone who wants to search the geographical origins of ancestors from England in the 19th Century.
You can select to view the different administrative boundaries via a drop-down menu. You can also select an old Ordnance Survey map as the base layer instead of the Google Map. You can search for towns by name and it is also possible to click on the different administrative boundaries on the map to view further details about a location.
Plants at Risk
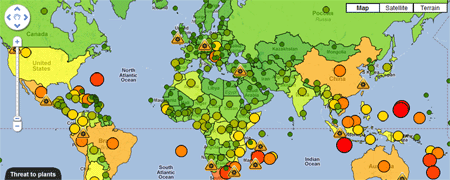
Did you know that with one in five plant species in the world are threatened with extinction?
Kew Royal Britannic Gardens together with the Natural History Museum, London and the International Union for Conservation of Nature (IUCN) has completed a global analysis of the risk of extinction for the world’s plants. The results of this research are presented on four Google Maps.
The first map shows the average threat level of plant life in different countries around the world. The second map shows the percentage of plant species under threat in different countries around the world. A third map shows the proportion of plant species unique to each country.
A fourth map has also been created to give an indication of the level of confidence that the researchers have in the data for each country.
Syria Monday 15/08/2011

The Syrian Uprising 2011 Information Center has created a Google Map of videos shot by activists during Monday’s protests.
To view a video you need to click on a map marker and click through to watch the video on YouTube. The map markers themselves are colour-coded to show towns with reported protests, towns on strike and towns under attack or besieged.
The Iraq Museum on Street View
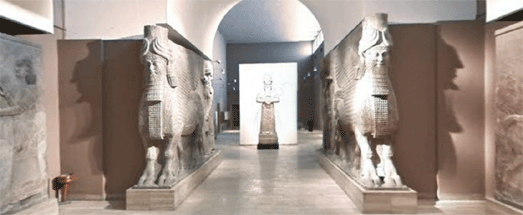
Iraq’s National Museum in Baghdad is now on Street View.
As well as collecting Street Views of the interior of the museum Google also managed to capture close-up 360-degree views of individual artifacts, a selection of which can be seen on the Antiquities page of the Iraq Museum website.
A neat addition to the Street View controls on Google Maps allows allows the user to navigate between the 1st and 2nd floor of the museum. So Street View now goes upstairs as well as to Iraq!
 In the UK I think it is now illegal to try and connect the recent rioting with social deprivation or economic inequality. The government and the mainstream media has decided that unless you blame bad parenting, social networking sites or a breakdown of moral order for the riots then you should be publicly castigated as a supporter and excuser of wanton criminality.
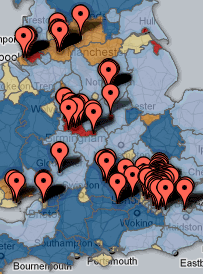
The Centre of Full Employment and Equity seem to be ignoring this new political orthodoxy by creating a Google Map overlaying the location of riot incidents on top of unemployment data.
The British Local Unemployment and the August 2011 Riots Map includes two layers: the local area unemployment rate range and riot incident data from the UK Guardian Open Data Blog.
The dark blue areas on the map show areas with high employment rates. At the risk of encouraging a visit from the UK thought police I have to say that the areas with high employment rates seem to have been largely unaffected by the recent rioting.
The Guardian themselves have used the riot incident data to create a Riots & Poverty Data Map.
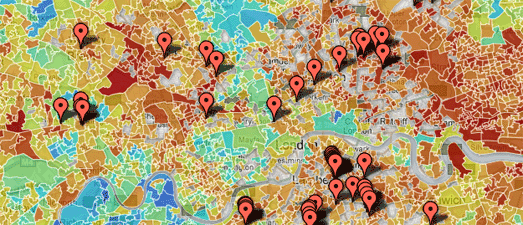
The Guardian says that “The darker reds represent poorer places, the blues are the richer areas. What do you think? Is there a correlation between the two?” I’m going to say it – ‘Yes, there is’.
Someone has also taken a KML from the London Riots – Verified Areas map and displayed it on MapTube Map with the Index of Multiple Deprivation (IMD). The IMD is a method of identifying deprived areas across the UK.
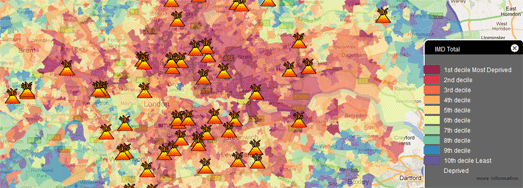
Overlaying the locations of the riots and looting on top of the IMD layer reveals that most of the trouble is occurring more in areas with high deprivation than in more affluent locations.
Whilst we are on the subject of the UK riots Directions Magazine has a good podcast discussion looking at the challenge of using social media as geodata and what journalists, geospatial professionals and the public can learn from these efforts.
The Guardian – Berlin City Guide
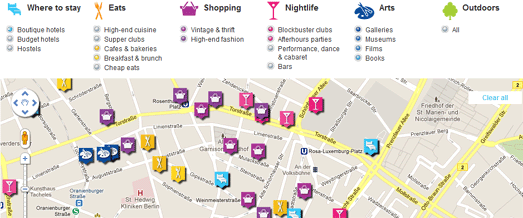
The Guardian’s Google Maps based city guides now includes Berlin.
The Berlin City Guide maps the best places to stay, eat and shop in the German capital and also maps great bars, clubs, museums and galleries to visit. You can select a category to view on the map from the menu above the map. When you select a category as well as dropping the appropriate markers on the map a list of the venues is displayed beneath the map.
If you select an individual venue, by clicking a marker or from the list beneath the map, The Guardian’s review of the location will then be displayed.
NYT Travel Guide to Paris Map
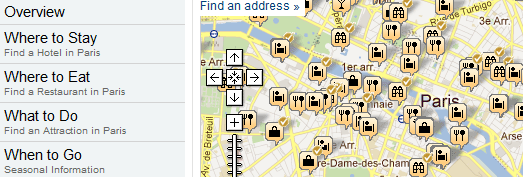
If you want an alternative to The Guardian’s Google Maps city guides then you need look no further than the New York Times. The NYT’s Travel section provides Google Maps based guides for many of the most popular tourist destinations around the world.
Each of the city guide maps allow you to select different categories of markers to view on the map. The categories are hotels, restaurants, attractions, shopping and nightlife.
As well as using the map as a guide to the city you can use the links in the map sidebar to click through to the New York Times’ recommendations in each category.
Brazil’s Cachaças on Google Maps
Brazil’s most popular alcoholic drink is cachaça. In fact it is so popular that there are over 4000 cachaça distilleries in Brazil.
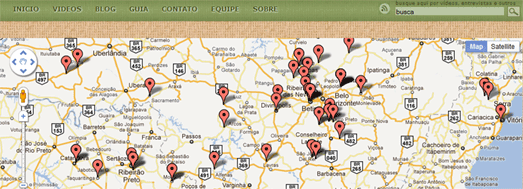
Guia Mapa da Cachaça is a crowd-sourced map plotting the location, photos and histories of Brazil’s cachaças and cachaças distilleries. The Google Map of the distilleries allows you to find where each cachaças is made and can help you find your nearest, locally distilled cachaças.
In other news, Google LatLong revealed today that Street View of the Amazon rainforest is currently being captured. So very soon, you’ll be able to float down the Amazon and Rio Negro Rivers of northwest Brazil and experience some of the most remote and biodiverse areas in the world with Google Maps Street View.
Country Explorer
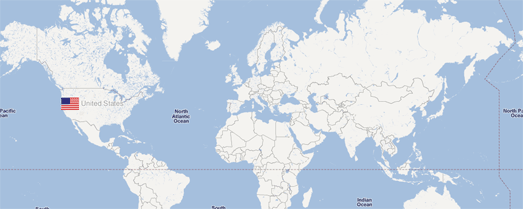
Country Explorer uses Google Maps Styles to create a very simple but effective game with Google Maps. Using the game you can test your knowledge of the countries of the world by guessing the name of a country and clicking on the map to see if your guess is correct.
Using Map Styles a Google Map has been created without country or other administrative labels. When the map user clicks on the map the Google Maps API geocoder is used to determine which country the user clicks on. The map then loads the name of the country and the country’s flag.
The game could be developed a little more by prompting the user to find a particular country and keeping a score of correct guesses. A timer could also be added for each guess to rack up the tension a little.
