Google Street View Generator
Giacomo Andreucci has released a wizard called Google Street View Generator. Giacomo’s wizard even lets you set the size of your Street View static image and can display a preview.
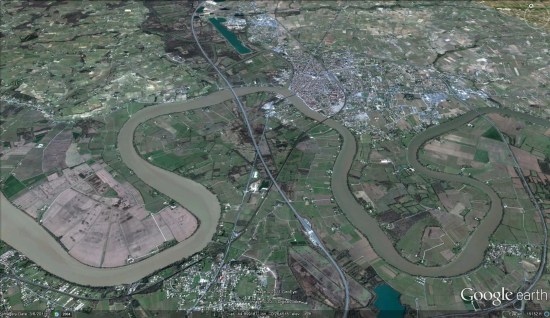
The New Jersey State Atlas
The New Jersey State Atlas is using Google Maps to showcase aerial photography of the entire state taken in the 1930’s (OK … I admit there is no satellite imagery from the 1930’s).
The opacity of the aerial photo layer can be adjusted. This means it is possible to compare the aerial view of the state in the 1930’s to Google’s current satellite imagery and observe how the state has developed over the last 80 years.
The map also includes the option to view Google Maps’s annotated roads and to switch to the map view. It is therefore very easy to find locations in the state that you might want to see with the 1930’s aerial view.
Uboot-sim!
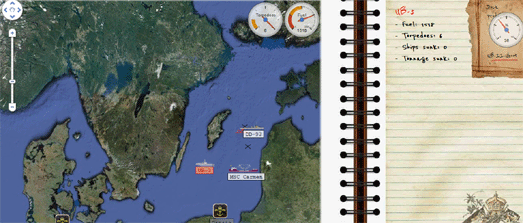
Uboot-sim! is a Google Maps based game, inspired by WWI submarine combat. In the game you control submarines in the North Sea and the Atlantic sea, hunting freighters and avoiding dangerous destroyers.
You can move your ships and hunt down your opponents’ boats by right clicking on the map. The game includes some clever collision detection algorithms, which means you can’t move your ships over land.
If your ships get destroyed by your opponents you can build new ships and U-boats in your dockyards.
DART St. Louis 2011
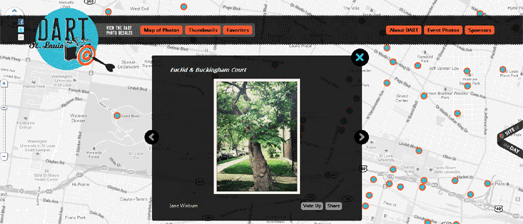
In April 2011 over 250 creative St. Louisans gathered to throw darts at a huge map of the City of St. Louis. Participants then had one month to visit the area where their dart landed and take a photograph.
DART St. Louis 2011 is a Google Map of the resulting collection of photographs. It provides a wonderful snapshot of St. Louis as it is today, one random block at a time.
Neighborhood Change in Connecticut
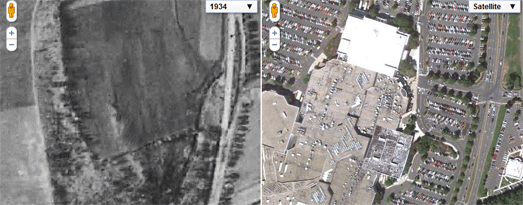
Neighborhood Change in Connecticut lets you view aerial imagery of Connecticut from 1934 side-by-side with the modern satellite view on Google Maps.
This map, created by the Trinity College and University of Connecticut Libraries Map and Geographic Information Center, lets you explore the changing landscapes of Connecticut from the 1930’s to the present. The dual map control allows you to zoom in on different areas and compare the past and present views. For example, in the picture above you can see commercial development on formerly rural farmland.
As well as imagery of Connecticut from 1934 the map includes aerial imagery from 1990, 2004 and 2006.
45° imagery transitions
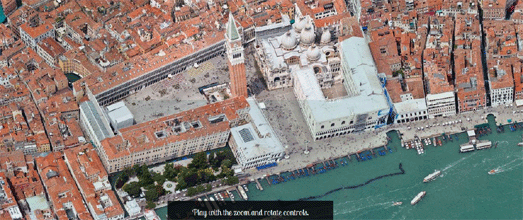
Google have added some cool transitions for the 45° imagery (Bird’s Eye view) in Google Maps. Now when you zoom in and out of the 45° imagery in Google Maps there is a smooth transition between the different zoom levels. Google have also added transitions when you rotate the imagery.
The transitions only work in Google Chrome at the moment. To see the transitions in effect check out this animated view of Venice in Google Chrome.
DFLD Radar
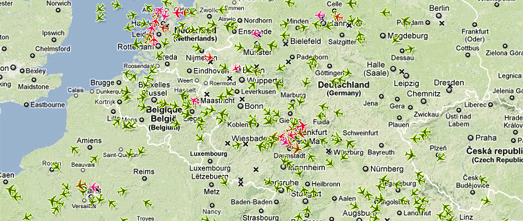
DFLD Radar is a Google Map of real-time air traffic over Europe.
There are quite a few live aircraft tracking maps already but DFLD Radar has a nice USP. DFLD Radar colour-codes the aeroplane map markers by altitude. The redder map markers indicate that the plane is flying at a lower altitude and the greener markers show planes flying at a higher altitude.
You can also click on any of the plane markers to read further details, such as the type of plane and vertical speed.
Fluglärmkonturenkarten
One consequence of all that aircraft traffic over Europe is quite a lot of noise pollution. Fluglärmkonturenkarten (you really do have to admire Germany’s skill in eradicating those useless spaces that other languages insert between words) is a series of Google Maps showing noise pollution around Frankfurt Airport.
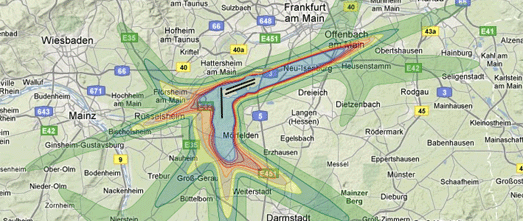
These heat maps show noise levels around the airport using data from 2007 and also show noise level predictions for 2020 in two different traffic modes.
Berlin Elections Map
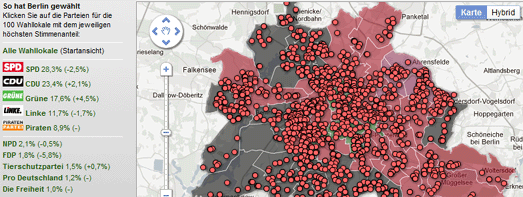
The Beliner Morgenpost has used Fusion Tables to create this nice Berlin Elections Map. The election was held on September 18th to elect members to the Abgeordnetenhaus. All 141 seats were up for election.
The map allows you to click on any of the political parties and view the constituencies where their candidates won. It is also possible to search the map by address or by district to view local results.
Census Map Maker
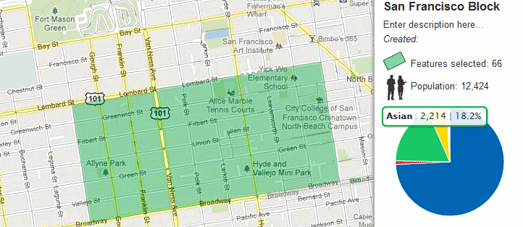
The Wall Street Journal’s Census Map Maker lets you create your very own census map for any neighborhood.
Once you have logged into the Census Map Maker with your Facebook or Twitter account you can start building your map. To create a map you simply need to click on the census blocks that you are interested in on a Google Map and then press ‘save’.
That is essentially it. Once you have clicked on your chosen census blocks you have your very own census map. The map can show the race breakdown for each block you clicked and for the entire selected area. The map even comes with it’s own pie chart of race and ethnicity in your defined neighborhood.
Shaded Relief Map
The Shaded Relief Map fills in a couple of Google Maps missing map types.
As well as providing the usual satellite, map and hybrid layers the Shaded Relief Map includes a shaded relief and a natural map layer. The natural map layer displays Tom Patterson’s Natural Earth map.
The Shaded Relief Map also includes a number of handy tools. Users can click anywhere on the map to find the elevation at that point. Users can also measure the distance between two points on the map and measure an area, for example a building or piece of land.