Adding a Custom Field to a Mailing Label
The first task was to modify the default fields displayed on the mailing label (name, address, postcode etc.) to include a custom field. This organisation delivers a lot of its local mail by hand rather than through the royal mail, so the custom field was used to assign addresses into a delivery walk, and this was to be printed on the label so it could be given to the appropriate deliverer.
Fortunately, CiviCRM uses a token replacement system, and every user-created custom field is assigned a unique token. The only problem in including the deliverer custom field on the mailing label was finding out what the token corresponding to the appropriate field was.
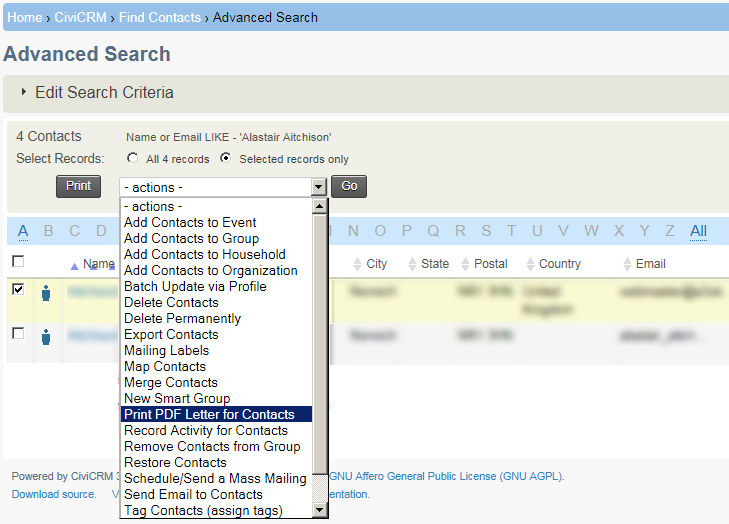
I’m sure there must be a better way, but the quick solution that worked for me was to bring up the “Print PDF Letter for Contacts” action from a search result
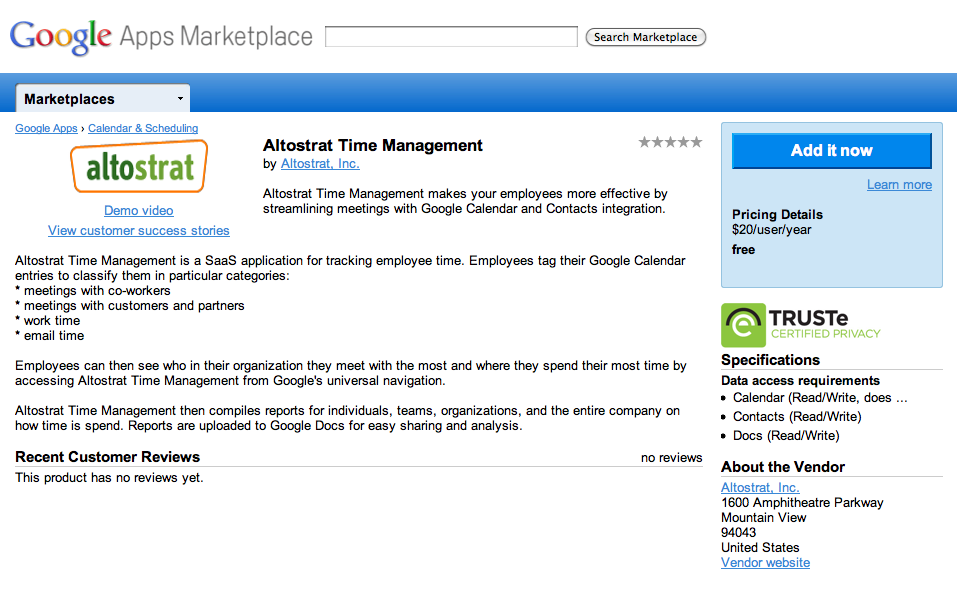
On the next screen, click the “Insert Tokens” link at the top right to be presented with a modal dialog box listing all the names of all the available tokens in your system. Clicking on the name of a token will insert it into the PDF letter, allowing you to see the token behind it. In the screenshot below, for example, the Geo Code 1 field associated with each individual contact can be inserted into any mailing (or mailing label) using the {contact.geo_code_1} token.

Having identified the appropriate token for a custom field (in my case, it was{contact.custom_4} ), you can then add this to the mailing label template by going toAdminister >> Configure >> Global Settings >> Address Settings and editing the Mailing Label Format to include the relevant token, as below:
{contact.addressee}
{contact.street_address}
{contact.supplemental_address_1}
{contact.supplemental_address_2}
{contact.city}{, }{contact.state_province}{ }{contact.postal_code}
{contact.country}
{contact.custom_4}
Sorting the Mailing List
Having ensured that the custom field was printed onto each label, the next step was to sort the list of labels based on the value of that field. As explained before, the mailings were to be hand-delivered, and it would save a lot of time sorting through the envelopes if they could be printed ready-sorted into batches for the appropriate deliverer, as specified by the custom field. A quick search of the internet reveals that sorted mailings are also required in other circumstances as well, such as sorting by ZIP code when submitting batch mailings to the U.S. Postal Service. However, although reported as a major bug in CiviCRM, the ability to sort mailing lists in anything other than alphabetical surname order of addressee is currently not possible. So I had to hack something together.
A snoop around revealed that the bulk of the work in preparing the mailing labels occurred in the script located at \sites\all\modules\civicrm\CRM\Contact\Form\Task\Label.php. Within the CRM_Contact_Form_Task_Label class in this file, I created a new comparison function which would sort an array of the items to be included in the mailing list based on the custom_4 field, as follows:
[php]
function cmpCustomField($a, $b) {
if ($a[‘custom_4’] == $b[‘custom_4’]) {
return 0;
}
return ($a[‘custom_4’] < $b[‘custom_4’]) ? -1 : 1;
}
[/php]
Through a bit of experimentation, I determined the best place to sort the records was after they had been run through the “Merge same address”/“Merge same household” scripts, but before being formatted for display. So I inserted a call to the PHP uasort function (sorts an associative array while keeping indexes) that used my comparison function at around line 330, as follows:
[php]
…
if ( isset( $fv[‘merge_same_household’] ) ) {
$rows = $this->mergeSameHousehold( $rows );
$individualFormat = true;
}
// INSERT CUSTOM SORT HERE
uasort ( $rows , array($this, ‘cmpCustomField’));
// format the addresses according to CIVICRM_ADDRESS_FORMAT (CRM-1327)
require_once ‘CRM/Utils/Address.php’;
foreach ($rows as $id => $row) {
…
[/php]
The mailing list labels were now produced in nicely ascending order based on the custom field.
Changing the Mailing Label Paper Template
CiviCRM supports a handful of common avery label formats out-of-the-box, but this organisation had recently purchased a bulk load of non-standard labels (A4, 24 labels per page, 8×3) which did not fit any of the supplied templates. They therefore couldn’t be used.
To create a new paper template, changes to two files must be made (both called “Label.php”, but in different directories).
Firstly, in the \sites\all\modules\civicrm\CRM\Utils\PDF\Label.php look for the $averyLabels array and add a new element to the array with the margins and other dimensions of your label sheet. Here’s the settings I used for my new paper (NX and NY are the number of columns and rows of labels on the sheet, width and height determined by dividing the overall dimensions of the page by the number of labels, and the margins determined mostly by guesswork):
[php]
$averyLabels = array (
…
‘Custom_3x8’ => array(
‘name’ => ‘NGP_3x8’,
‘paper-size’ => ‘A4’,
‘metric’ => ‘mm’,
‘lMargin’ => 5,
‘tMargin’ => 10,
‘NX’ => 3,
‘NY’ => 8,
‘SpaceX’ => 0,
‘SpaceY’ => 0,
‘width’ => 70,
‘height’ => 37.125,
‘font-size’ => 9
)
);
[/php]
Having defined the settings for the Custom paper template, to actually get these settings to be selectable when producing mailing labels, you also need to edit the file at\sites\all\modules\civicrm\CRM\Contact\Form\Task\Label.php
Near the top is a buildQuickForm() function that contains an array of templates to populate a select list. Add the name of your new paper template to the end of the array, exactly as you defined it in the $averyLabels array above:
[php]
$label = array(
"5160" => "5160",
"5161" => "5161",
"5162" => "5162",
…,
"Custom_3x8" => "Custom_3x8"
);
[/php]
Save the file, and your new template will magically become available for use:
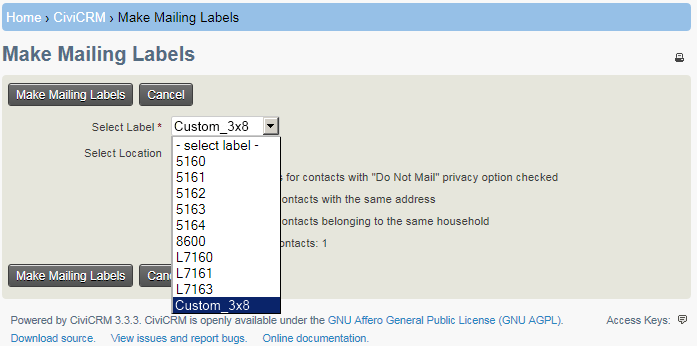
A few tweaks…
Finally, there were just a few tweaks to be made. The new paper template should be always be selected by default for mailing labels (they’d bought reams of the stuff, so it was going to be used for all labels for quite a while yet), and also the “merge contacts with the same address” should always be selected. Adding these defaults was a simple matter of amending the $defaults array declared in the setDefaultValues() function near the top of the \sites\all\modules\civicrm\CRM\Contact\Form\Task\Label.php file.
[php]
function setDefaultValues()
{
$defaults = array();
$defaults[‘do_not_mail’] = 1;
// Modified by AA
$defaults[‘merge_same_address’] = 1;
$defaults[‘label_id’] = "Custom_3x8";
return $defaults;
}
[/php]
I’m no CiviCRM expert, and I’ve certainly no idea if the approach I took to solving any of these problems represents “best practice” in any way, but it seems to have got the job done and met the immediate needs of my client, so hopefully it might be helpful to somebody else too!