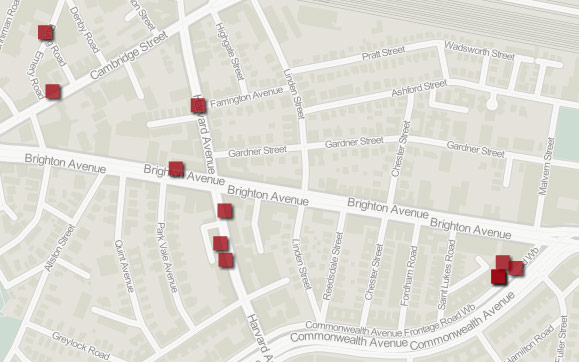
Over on the Bostonography Blog, Andy is muses about the spatial arrangement of humorous retailers in Cambridge. It’s inspired by The Simpsons and has some great looking maps (like the above) from GeoCommons.
The Furniture District

Over on the Bostonography Blog, Andy is muses about the spatial arrangement of humorous retailers in Cambridge. It’s inspired by The Simpsons and has some great looking maps (like the above) from GeoCommons.
Andy’s made a great looking map of small-multiples showing the breakdown of how streets were named in Cambridge, MA. Those of you familiar with the area will have fun trying to recognize the highlighted streets. Everyone else can marvel at how useful the small-multiple technique is at making easy comparisons across a complex dataset.
This week, we’re happy to begin a 30-day preview of one of our most distinctive interactive mapping projects: The London Low Life Map. This map was produced for Adam Matthew Digital, a digital publishing company based in the UK. Adam Matthew produces digitized archives of historic primary source documents, collected around a central theme, for higher education institutions. This map was built as part of their London Low Life collection that explores the seedy underbelly of Victorian London. It examines the documents of sex, drinking, gambling, and the institutions that sprang up to combat those very vices. As the map is integrated into Adam Matthew’s collection, we will only be able to grant access to our readers for 30-days. I encourage you to explore the map and enjoy Adam Matthew’s fantastic collection of historic maps and images. Since we’ve pulled the map out of the collection, I wanted to give you some context on what is included.
The full London Lowlife project gives users access to a mountain of primary source documents from Victorian London, so it only makes sense that we start with maps made of greater London during this era. We’ve included some metadata with each of these maps (author, date, publisher) to give historical context and placed them on top of a custom Cloudmade basemap (with adjustable opacity) to give some modern context as well.
Taking these historical maps from raw image to geographically accurate overlay was an incredibly intricate procedure. While some maps existed as single, contiguous images, others were scanned in their current forms as pages, separated by fraying canvas. Before we could rubbersheet the maps to OpenStreetMap data (with the help of the UW Cart Lab), we had to manually remove the seams and align the resulting image fragments to one another. Furthermore, because these maps were at different sizes and scales, we had to build a system that would identify maps with limited resolutions and restrict the zoom levels available on the fly.
It’s fascinating to view the changes in the street maps over time, especially which streets were given primary status then and now.
In the mid-nineteenth century, John Tallis drew detailed views of the fronts and façades of buildings along Central London’s streets. Originally designed as a “visual yellow-pages” (businesses would pay to have their shops labeled), his 88 plates now survive as a first-person perspective into the streets of Victorian London.
We wanted to make these plates as immersive as possible. With the help of AMD’s editorial staff, we took Tallis’ original image and added some color to sharpen the images, shadows to depth, and a blue-sky background to increase the realism of the images. Finally, the images were run through Google Sketchup to create the perspective views that place you in Victorian London and allow you to look down either side of the street.
Be sure to click the “view original” button to see the original plates to view the intricate detail surrounding the street images.
While the historic basemaps and Tallis Streetviews of the London Lowlife map attempt to provide insight into the qualitative aspects of Victorian London geography, we also wanted to explore the changing character of the population through quantitative thematic mapping. Simple demographic measures like population and density can provide a major insight into the nature of a city. However, we believe the most telling indicator of life in Victorian London, and certainly true to the name “low life” ascribed to this project, is the explosion in social services that sprung up throughout the city to deal with the new urban population.
By dragging the timeline to view an animation of the entire century, you can watch population increase in various sections of the city and then the services emerge to try and meet the need.
The final section of the map gives a taste of the larger London Lowlife project by placing a selection of the primary source documents on the map. It’s an engaging way to explore city by viewing some fantastic records of the landscape and people of Victorian London.
Mouse over a category point on the legend list to quickly highlight all corresponding points.