Google Maps Mashups 9

Google Maps meet Maori Maps


This Google Map displays the locations of the tribal marae of Aotearoa New Zealand. A marae is a communal or sacred place, the centre of Maori identity and activity.

Maori Maps is a nationwide map of Aotearoa marae, with photos of each marae, contact and background information, and photographs. Currently the map displays marae in the Tai Tokerau (Northland) and Tamaki (Auckland) regions. Eventually the map will show all of Aotearoa’s more than 800 ancestral marae.

Maori Maps

Google Aquires Dealmap


Dealmap’s biggest deal of today was selling itself to Google.

Websites offering daily deals and coupons have been one of the biggest trends in the location sector for a couple of years now. Google has been pretty keen to get into this market, which has so far been dominated by Groupon.

However Google has, until now, been painfully slow in rolling out its own Google Offers site. Google Offers launched in April promising daily offers – but the deals were initially only available in Portland, Oregon. Since then Google have rolled out the service to other areas but it is still limited to New York, San Francisco, Oakland and Portland.

By acquiring Deal Map Google can now access Dealmap’s deal exchange distribution network and presumably hopes to tap into Dealmap’s over 2 million users.

Google is not the only big player to have had an eye on Dealmap. Back in March Dealmap signed a deal with Bing to display deals on the homepage of m.bing.com.

For now Dealmap says it will continue as a distinct service. However my guess is that at some point in the future Dealmap and Google Offers will morph into one product (probably called Google Offers).

Google Maps at the Fringe


The world’s largest art festival the Edinburgh Fringe is due to start on Friday.

With over 2,000 different comedy, musical and theatrical shows taking place in over 250 different events what is needed is a Google Maps guide to the Fringe.

Enter stage right – Gigglemaps.

Using Gigglemaps you can click on any Edinburgh Fringe Festival venue and view the next five performances. The map includes a menu that allows you to filter the venues by category, such as comedy, cabaret etc.

Gigglemaps

The Google Maps Guide to Hiking in Norway


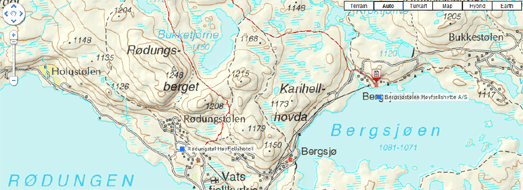
UT.no is a complete guide to hiking in Norway. The site features hiking routes, cabins, a calendar of events and a hiking map built with the Google Maps API.

As well as the usual Google Map views the map features detailed topographical map tiles. Using the menu in the map sidebar you can select to view cabins, summer trails, winter trails, videos, articles and even current skiing conditions.

Kart – UT.no

Boston’s Buses Live on Google Maps


With TransitSpy you can follow Boston’s MBTA buses live on Google Maps.

Using the sidebar you can select any combination of MBTA bus routes and view in real-time the position of the buses on those routes. As well as the live buses all the stops on a route are displayed on the map. If you click on a bus-stop’s map marker you can see how long you will have to wait until the next bus arrives.

TransitSpy MBTA

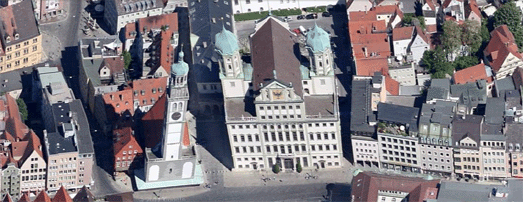
Loads More Birds Eye View


Mezquita-Catedral

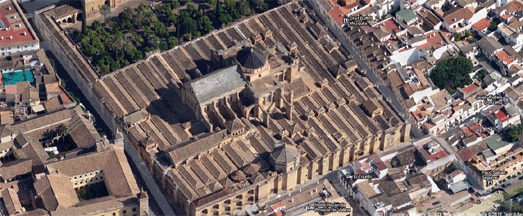
Google Maps today has a lot more aerial view imagery. The update includes new 45° imagery in the U.S., Canada, Germany, Argentina and Spain.


Parliament, Ottawa

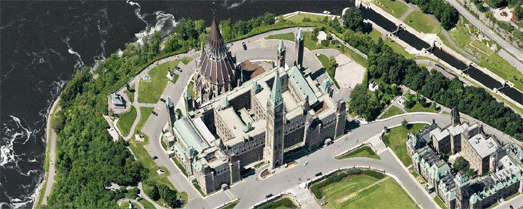
Here’s a list of the updated cities:

Augsburg, Germany. Barstow, CA. Bartlett, TX. Big Bear, CA. Blackstone, VA. Catalina Foothills, AZ. Córdoba, Spain. Delano, CA. Desert Hot Springs, CA. Richmond, VA. Elgin, TX. Healdsburg, CA. Helendale, CA. Hemet, CA. Houston, TX. Mendoza, Argentina. Midlothian, VA. Napa Valley, CA. New Braunfels, TX. Ojai, CA. Ottawa, Canada. Pensacola, FL. Porterville, CA. Plant City, FL. Rancho Del Lago, AZ. Rosario, Argentina. Santa Clarita, CA. Sarasota, FL. Taylor, TX. Temecula, CA. Treasure Island, CA. Troy, IL. Twentynine Palms, CA. Wakefield, VA. Yucca Valley, CA.


Rathaus, Augsburg

googlemapsmania

SQL Server: Easy Bulk Loading OS Locator Road Data

I’ve just loaded the Ordnance Survey “OS Locator” dataset (part of Ordnance Survey Open Data) into SQL Server 2008. OS Locator contains details of all the roads in Britain, in a gazetteer-style format. It is a 120Mb delimited text file, containing details of around 790,000 road entities (some roads are split into multiple entities if they cross districts etc.) – including the road name, the coordinates of its bounding box and centrepoint, classification, and the county and area in which it is located. (Note that this dataset doesn’t include the geometry of the shape of the road itself). You can find the technical specifications for the OS Locator dataset here: http://www.ordnancesurvey.co.uk/oswebsite/products/oslocator/docs/user_guide.pdf

Since the file is text-based, there’s a range of options available to import it – you could create an SSIS package, or use the import/export wizard, or one of a variety of third party ETL tools. However, for an absolutely dead-easy way to query the data and create a geometry point representing the centre of each road using purely T-SQL, I used the OPENROWSET bulk function in conjunction with a format file.

Not only is this method easy, but it’s utterly repeatable so (assuming the structure of the source data remains constant) you can run it again each time the underlying data gets refreshed. OPENROWSET allows you to query the text file source directly, as if it were a table in the database, from which you can SELECT columns of data, INSERT them into other tables etc.

The following shows the xml format file I used to specify the columns of data in the OS Locator file:

[php]<?xml version="1.0"?>
<BCPFORMAT xmlns="http://schemas.microsoft.com/sqlserver/2004/bulkload/format" xmlns:xsi="http://www.w3.org/2001/XMLSchema-instance">
<RECORD>
<FIELD ID="0" xsi:type="CharTerm" TERMINATOR=":"/>
<FIELD ID="1" xsi:type="CharTerm" TERMINATOR=":"/>
<FIELD ID="2" xsi:type="CharTerm" TERMINATOR=":"/>
<FIELD ID="3" xsi:type="CharTerm" TERMINATOR=":"/>
<FIELD ID="4" xsi:type="CharTerm" TERMINATOR=":"/>
<FIELD ID="5" xsi:type="CharTerm" TERMINATOR=":"/>
<FIELD ID="6" xsi:type="CharTerm" TERMINATOR=":"/>
<FIELD ID="7" xsi:type="CharTerm" TERMINATOR=":"/>
<FIELD ID="8" xsi:type="CharTerm" TERMINATOR=":"/>
<FIELD ID="9" xsi:type="CharTerm" TERMINATOR=":"/>
<FIELD ID="10" xsi:type="CharTerm" TERMINATOR=":"/>
<FIELD ID="11" xsi:type="CharTerm" TERMINATOR=":"/>
<FIELD ID="12" xsi:type="CharTerm" TERMINATOR=":"/>
<FIELD ID="13" xsi:type="CharTerm" TERMINATOR=":"/>
<FIELD ID="14" xsi:type="CharTerm" TERMINATOR=":"/>
<FIELD ID="15" xsi:type="CharTerm" TERMINATOR="\r\n"/>
</RECORD>
<ROW>
<COLUMN SOURCE="0" NAME="Name" xsi:type="SQLVARYCHAR"/>
<COLUMN SOURCE="1" NAME="Classification" xsi:type="SQLVARYCHAR"/>
<COLUMN SOURCE="2" NAME="Centx" xsi:type="SQLINT"/>
<COLUMN SOURCE="3" NAME="Centy" xsi:type="SQLINT"/>
<COLUMN SOURCE="4" NAME="Minx" xsi:type="SQLINT"/>
<COLUMN SOURCE="5" NAME="Maxx" xsi:type="SQLINT"/>
<COLUMN SOURCE="6" NAME="Miny" xsi:type="SQLINT"/>
<COLUMN SOURCE="7" NAME="Maxy" xsi:type="SQLINT"/>
<COLUMN SOURCE="8" NAME="PostSector" xsi:type="SQLVARYCHAR"/>
<COLUMN SOURCE="9" NAME="Settlement" xsi:type="SQLVARYCHAR"/>
<COLUMN SOURCE="10" NAME="Locality" xsi:type="SQLVARYCHAR"/>
<COLUMN SOURCE="11" NAME="Cou_Unit" xsi:type="SQLVARYCHAR"/>
<COLUMN SOURCE="12" NAME="LocalAuth" xsi:type="SQLVARYCHAR"/>
<COLUMN SOURCE="13" NAME="Tile_10k" xsi:type="SQLVARYCHAR"/>
<COLUMN SOURCE="14" NAME="Tile_25k" xsi:type="SQLVARYCHAR"/>
<COLUMN SOURCE="15" NAME="Source" xsi:type="SQLVARYCHAR"/>
</ROW>
</BCPFORMAT>[/php]

Assuming that the format file above is saved as c:OSLocator_formatfile.xml, and the OS Locator download itself is saved as c:OS_Locator2010_2_Open.txt (the filename of the most recent locator download at the time of writing), then you can load the Locator dataset directly in SQL Server, creating a geometry point at the centre of each road in a single query as follows:

[php]SELECT *,
geometry::Point(Centx,Centy,27700) AS Centre
FROM OPENROWSET(
BULK ‘C:OS_Locator2010_2_Open.txt’,
FORMATFILE=’C:OSLocator_formatfile.xml’
) AS CSV;[/php]

And here’s what the data looks like:

image

Here’s the spatial results tab displaying the centre points of the first 5,000 rows of data:

image

And here’s what a small section of Norwich looks like having created a bounding box from the min/max coordinates of each road and overlaying them on Bing Maps (having first transformed the coordinates from EPSG:27700 to EPSG:4326):

image

Google Developer Day Sydney – James Macgill

Mapplets: Making Maps Mashups Discoverable Presented by James Macgill Thousands of Google Maps mashups have been created in the two years since we released the Google Maps API, but most of these sites are islands of information and few users know that they exist. We will discuss an approach to make these sites more discoverable by users around the world