Captain James Cook’s circumnavigation of New Zealand

Back in the mid-1700’s, Captain James Cook made a variety of discoveries around the world including the first European contact with the eastern coastline of Australia and the Hawaiian Islands. In addition, he recorded the first circumnavigation of New Zealand.

Colin Hazlehurst has put together an amazing tour of Cook’s circumnavigation, featuring an excellent 3D model of his ship, constructed by Phillip Müller.
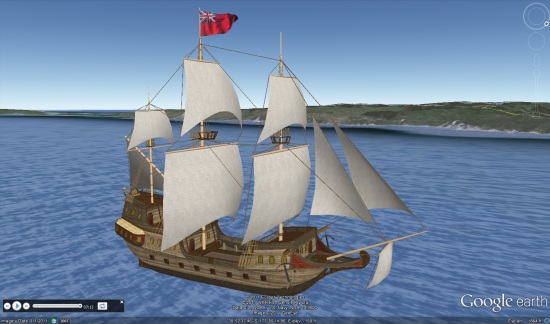
ship.jpg

To see it for yourself, you can download this KML file.

Here’s a brief overview of Cook’s journey, taken from the KML file:

His Majesty’s Bark Endeavour sailed from Plymouth on Friday, 26Aug1768 with Lieutenant James Cook as Commander. The mission of the Endeavour was to boldly go…oh no that’s Kirk not Cook.

The first objective of Cook’s voyage was to observe the transit of Venus from the island of Tahiti in June, 1769, and after that to explore the Pacific with a view to determining whether or not there was a large southern continent.

At 2 p.m. on Saturday, 7th October, 1769, land was seen from the masthead of Endeavour bearing west by north; this was the North Island of New Zealand and James Cook gave the order to stand in for it.

The ship anchored in Poverty Bay in the afternoon of 8th October, yet it took another four months to complete the circumnavigation of the island.

From Poverty Bay, Cook first took the Endeavour southwards along the coast as far as Cape Turnagain, where he decided it would be more fruitful to explore to the northwards. By meticulous observation of the sun, moon, and stars, Cook charted the coastline, noting the hazards to shipping and the places where there was safe anchorage and plentiful wood and water.

Always along the way, he tried to befriend and trade with the people he met, though not every encounter was successful. There were well-armed, warlike people who lived in strategically placed strongholds, but also friendly and curious people who were happy to trade fish and other seafoods for cloth and nails. Cook always regretted the taking of life, but sometimes it was necessary in self-defence.

He rounded East Cape on 31Oct1769 and made his way along the coast in a broadly north-westerly direction. He made extended visits to the Bay of Islands and Mercury Bay, this last so named because they observed the transit of Mercury, and so were able to fix the latitude and longitude of the bay to a high degree of accuracy.

It took more than 3 weeks to round North Cape, in the face of westerly gales, strong currents, and a broad swell. Cook found it impossible to land on the ‘dangerous’ west coast of North Island, finding no safe harbour or anchorage. He rounded Cape Egmont and made his way to Queen Charlotte Sound where the ship was careened and scrubbed.

After narrowly avoiding the small islands called The Brothers, Cook took Endeavour through Cook Strait and started to explore the east coast of South Island. However, to prove to his officers that North Island was indeed an island and not part of a larger continent, he took advantage of a favourable wind to complete the circumnavigation of North Island on 09Feb1770.
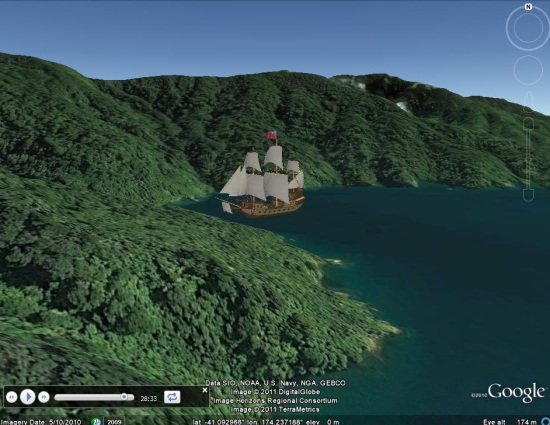
ship2.jpg

In Colin’s words, here’s how the file itself works:

This Google Earth presentation animates the 3D model of a ship as it follows the track of the Endeavour, and is accompanied by a reading of Cook’s journal. The circumnavigation of North Island is divided into sections which have significant start and end points. In Google Earth terminology, each section is known as a ‘tour’.

To play a given tour, first find it in the Table of Contents folder. You will see the name of each tour displayed as a hyperlink against a Folder icon, e.g. Poverty Bay to Cape Kidnapper. A single click on the hyperlink will display an information balloon which shows, for that tour:

• The start and end dates of the journey.
• The duration of the tour in minutes and seconds, being the length of time it will take to play the tour in Google Earth.
• Start a tour by expanding the Folder to show the Tour icon and the title ‘Play’ and double-clicking the icon.

via: Google Earth Blog
Flood Simulation HowTo

In his novel Book of Dave‘, Will Self imagines a world in the future where sea levels have risen over a 100m.

This destroys civilization as we know it but leaves London skyscrapers still standing half underwater in the sea – the remaining humans who live on ‘Ham’ (an island created from the rising sea surrounding the high ground of Hampstead Heath, London) climb one of these which they call ‘Central Stack’ to capture seagulls. As the book has a map of Ham in the front I played around in Google Earth to see how accurate the boundary of the island actually was, as it happens, Will’s imaginary island is what would really occur if sea level rose that far.

I realised the technique I used (one a teacher pointed out to me at a training session a while back) could be used in a lesson to visualize rising sea levels or ancient ice sheets. If you draw a polygon and give it an altitude that is about ground level the sheet created will disappear below the ground where the land is higher but be visible where the land is lower. Here’s how to create a series of these sheets in a folder so you can show a sequence of increasing sea levels :

  1. Click the Temporary Places folder in the Places column (it will get a background) then right click > Add > Folder. Add a name in the dialogue box and tick the ‘Show contents as options’ box. You’ll see why in a moment.
  2. Navigate to a location you want to ‘flood’ in the main screen. Right click the folder you’ve just created > Add > Polygon. Move the dialogue screen that opened out of the way (I move it to the bottom of the screen) and click the 4 corners of a square. Make it less than 10 miles across otherwise wierd things happen to the layer because of the curvature of the earth (I think, see note below)
  3. Drag the dialogue box back into view and under the ‘Style, Color’ using the controls titled ‘Area’ select an appropriate color for the square (blue for sea level rise, white for an ice sheet?) also select an opacity of 30% or so.
  4. Under the Altitude tab choose an altitude of 100m and then select ‘Relative to Ground’ in the pull down menu. This will raise your colored square 100m above the ground.
  5. Name your square something sensible but with a ‘100’ in it (e.g. “London 100m”) then click OK.
  6. Now right click the element you created in the Places column and select copy. Right click the copy >Properties > Altitude and change the altitude to 200m. Change the name to replace 100 with 200 and click OK.
  7. You should now have 2 sheets, one at 100m altitude and one at 200m. Clicking in the circles turns one on and the other one off automatically.
  8. Experiment with altitudes that works for your chosen location, copy and paste more sheets if necessary by repeating step [6] – within the folder you created only one sheet will be visible at any one time.
  9. Right click the folder and select ‘Save As’ to save and send to someone else.
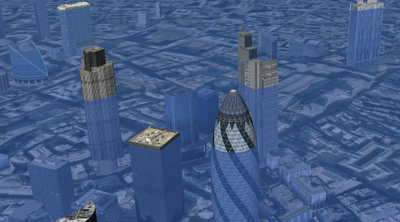
3D Buildings: It’s a lot of fun to turn on the 3D buildings layer whilst you have sheets visible in the layers column, as in the screeen shot the layers will show how deep buildings would be sunk in the sea – not sure if any of those in the screen shot are Central Stack.
Absolute Heights: Experimenting with the levels, the sheet behaves oddly, it doesn’t meet the land at the height you would expect. I’m not sure why this is but it may do with the curvature of the earth (in the middle of a big square the earth will protude through a level sheet even though there is no topography). If anyone has a definitive answer I’d like to know.

Surface Flicker: If you zoom into the layers from a distance you may see line of where land meets sheet flicker and change. This is because GEarth creates the view of the earth you see by taking the satellite images and draping them over a set of ‘posts’ it builds rather like a marquee tent. If you view the ground from a higher altitude GEarth uses fewer posts so the surface changes as you zoom in and out. There is a way around this but its fiddly, I’ll post about it if anyone’s interested.