The Fusion Table data on mobile devices

We’ve talked a bit about Google’s Fusion Tables product before — a great way to turn a table full of data (such as an Excel spreadsheet) into a fully functional map!

The maps can easily be shared through a Google Maps interface or even in Google Earth, but the mobile support for Fusion Table projects has been pretty weak. That’s where the folks from Build-A-Map have stepped in, with a new product called My Fusion Tables.

my-fusion-tables.jpg

My Fusion Tables a mobile application that allows you to browse, view, and map data from Google Fusion Tables on both mobile phones and tablets. You can find it in the iOS App Store or on Google Play.

Find your perfect home with Google Fusion Tables

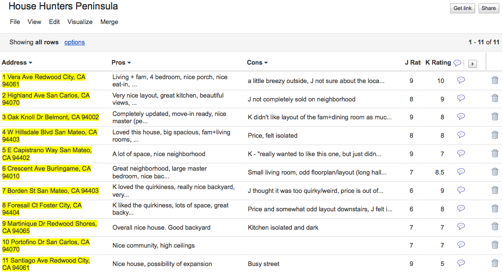
My husband and I were recently in the market for a new home. We worked with a realtor for a few months, looking at several houses every weekend. As we checked out each house, we tracked our thoughts about it in a Google spreadsheet, which included columns for the address, our pros and cons, individual ratings and the combined rating of the house.

One day, while my husband and I were rating a recently viewed home, he came up with a brilliant idea to put all of our home data on a map. We realized that adding geographic information to our personal opinions would help us find trends, such as which neighborhoods we preferred. A light bulb went on over my head: Google Fusion Tables!

Fusion Tables is a data management web application that makes it easy to view tabular data on a Google Map. Columns with location data, such as addresses, points, lines, or polygons, are automatically interpreted and mapped. The map features can be styled according to the data in your table. It’s also simple to share the map visualization with others.

In just a few steps, we were able to convert our spreadsheet into a fusion table:


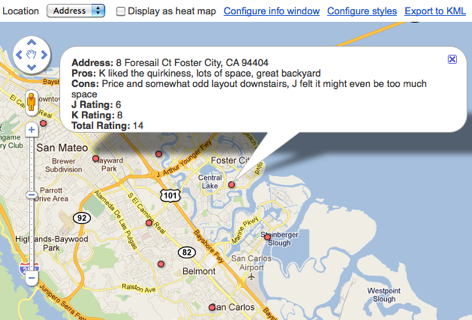
This was a great start, but what we really wanted was to quickly get a glimpse of this data on a map. All we had to do was select ‘Visualize > Map’ from the table menu and the data in the ‘Address’ column was geocoded (i.e. converted into latitude and longitude coordinates) and the markers were displayed on the map. Clicking on the markers showed additional information about the house pulled from our spreadsheet, including the pros, cons and ratings we inputted for each location.

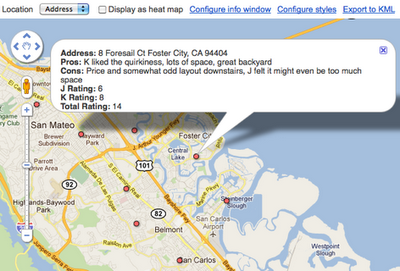
Our house ratings viewed in Google Maps (after being converted into a Fusion Table).
Fusion Tables also allow you to style the features on the map according to data in a numerical column in the table. We had the perfect column to use for this purpose: the ‘Total Rating’ column!


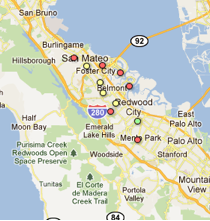
In order to color code the map markers by their ‘Total Rating’ score, we customized the icons based on a range of scores, with red representing the lowest scores, yellow show mid-range scores and green showing the houses with the highest combined rating. After saving these new settings, the map markers were immediately styled:


Our new map made it much easier to see what locations we were most interested in (the house just south of Redwood City) and the neighborhoods of low interest (those that were closer to the bay or hills).

We shared the map with our realtor and she loved it. It helped her refine the selection of homes she showed us and in just a matter of weeks, I’m happy to say that my husband and I found the perfect house!

Posted by Kathryn Hurley, Developer Programs Engineer, Geo DevRel

via: GoogleLatlong

The 2011 Google Earth Outreach Developer Grant awardees

The nonprofit mapping community is alive with amazing game-changing ideas. In May, Google Earth Outreach asked nonprofit organizations to think big: what kind of map would they want to create if they had the funding or developer resources to do so? We were thrilled by the number of applications we received, full of concrete ideas for tremendously impactful maps.

While it was difficult to select projects with the highest potential impact from the long list of great applications we received, we are excited to announce the Google Earth Outreach Developer Grant awardees. Each organization below proposed cutting-edge visualizations in the public benefit sector utilizing a broad spectrum of tools ranging from narrated tours in Google Earth to Google Maps and Places API applications for Android to Google Fusion Tables. In total, we’ve awarded over $300,000 to the Google Earth Outreach Developer Grantees. We wish to congratulate all awardees for developing proposals that we hope will help them make the world a better place.

These organizations are all currently making great progress towards their project goals. Within the coming months, they will complete development of their mapping applications. We look forward to sharing the completed projects with you on the Google Earth Outreach site, so check back soon!


Atlantic Public Media One Species at a Time: Stories of Biodiversity on the Move, with the Encyclopedia of Life (in Google Earth narrated tours)
California Academy of Sciences A Global Water Story: Translating immersive programming about water from the Planetarium to Google Earth
David Suzuki Foundation Our Natural Capital: mapping ecosystem services in southern Ontario, Canada
Golden Gate Parks Conservancy The Story of Crissy Field: the transformation of an urban park in Google Earth
HabitatMap, Inc. AirCasting: citizen air quality monitoring using Android devices
The HALO Trust Notes from the (Mine)Field: a Google Earth tour of humanitarian landmine clearance
International Rivers Network The Wrong Climate for Damming Rivers
The Nature Conservancy Adopt an Acre in Google Earth & Maps
Pepperwood Foundation, on behalf of iNaturalist.org iNaturalist App on Android: citizen naturalists armed with Android devices can upload photos of flora and fauna to iNaturalist.org
Save the Elephants Tracking Animals for Conservation: Real-time mapping in the field on Android and Publishing Elephant Tracking Data in Fusion Tables
Water for People SanMap: supporting sanitation-related businesses in urban African cities
When I Walk, Inc. AXSmap mobile app using Google Places API for reviews and ratings of accessibility
Widecast Wider Caribbean Sea Turtle Conservation Network – Bonaire Track Your Turtles: The Great Migration Game and sea turtle monitoring in Bonaire
World Resources Institute Google Earth Tour of Reefs at Risk
World Wildlife Fund Eyes on the Forest: Interactive map on Sumatran Deforestation


These organizations were funded through the Google Inc. Charitable Giving Fund at the Tides Foundation.

Google Fusion Tables with Apps Script

I started with Apps Script in the same way many of you probably did: writing extensions to spreadsheets. When it was made available in Sites, I wondered whether it could meet our needs for gathering roadmap input from our sales engineering and enterprise deployment teams.

Gathering Roadmap Data

At Google, teams like Enterprise Sales Engineering and Apps Deployment interact with customers and need to share product roadmap ideas to Product Managers. Product Managers use this input to iterate and make sound roadmap decisions. We needed to build a tool to support this requirement. Specifically, this application would be a tool used to gather roadmap input from enterprise sales engineering and deployment teams, providing a unified way of prioritizing customer requirements and supporting product management roadmap decisions. We also needed a way to share actual customer use cases from which these requirements originated.

The Solution

This required bringing together the capabilities of Google Forms, Spreadsheets and Moderator in a single application: form-based user input, dynamically generated structured lists, and ranking.

This sounds like a fairly typical online transaction processing (OLTP) application, and Apps Script provides rich and evolving UI services, including the ability to create grids, event handlers, and now a WYSIWYG GUI Builder; all we needed was a secure, scalable SQL database backend.

One of my geospatial colleagues had done some great work on a demo using a Fusion Tables backend, so I did a little digging and found this example of how to use the APIs in Apps Script (thank you, Fusion Tables Developer Relations).

Using the CRUD Wrappers

Full sample code for this app is available and includes a test harness, required global variables, additional CRUD wrappers, and authorization and Fusion REST calls. It has been published to the Script Gallery under the title “Using Fusion Tables with Apps Script.”

The CRUD Wrappers:

/**
 * Read records
 * @param {string} tableId The Id of the Fusion Table in which the record will be created
 * @param {string} selectColumn The Fusion table columns which will returned by the read
 * @param {string} whereColumn The Fusion table column which will be searched to determine whether the record already exists
 * @param {string} whereValue The value to search for in the Fusion Table selectColumn; can be '*'
 * @return {string} An array containing the read records if no error; the bubbled return code from the Fusion query API if error
 */
function readRecords_(tableId, selectColumn, whereColumn, whereValue) {

  var query = '';
  var foundRecords = [];
  var returnVal = false;
  var tableList = [];
  var row = [];
  var columns = [];
  var rowObj = new Object();

  if (whereValue == '*') {
    var query = 'SELECT '+selectColumn+' FROM '+tableId;
  } else {
    var query = 'SELECT '+selectColumn+' FROM '+tableId+
                ' WHERE '+whereColumn+' = ''+whereValue+''';
  }

  var foundRecords = fusion_('get',query);

  if (typeof foundRecords == 'string' && foundRecords.search('>> Error')>-1)
  {
    returnVal = foundRecords.search;
  } else if (foundRecords.length > 1 ) {
    //first row is header, so use this to define columns array
    row = foundRecords[0];
    columns = [];
    for (var k = 0; k < row.length; k++) {
      columns[k] = row[k];
    }

    for (var i = 1; i < foundRecords.length; i++) {       row = foundRecords[i];       if( row.length > 0 ) {
        //construct object with the row fields
        rowObj = {};
        for (var k = 0; k < row.length; k++) {
          rowObj[columns[k]] = row[k];
        }
        //start new array at zero to conform with javascript conventions
        tableList[i-1] = rowObj;
      }
    }
    returnVal = tableList;
  }

  return returnVal;
}

Now all I needed were CRUD-type (Create, Read, Update, Delete) Apps Script wrappers for the Fusion Tables APIs, and I’d be in business. I started with wrappers which were specific to my application, and then generalized them to make them more re-usable. I’ve provided examples above so you can get a sense of how simple they are to implement.

The result is a dynamically scalable base layer for OLTP applications with the added benefit of powerful web-based visualization, particularly for geospatial data, and without the traditional overhead of managing tablespaces.

I’m a Fusion tables beginner, so I can’t wait to see what you can build with Apps Script and Fusion Tables. You can get started here: Importing data into Fusion Tables, and Writing a Fusion Tables API Application.

Tips:

  • Fusion Tables is protected by OAuth.This means that you need to authorize your script to access your tables. The authorization code uses “anonymous” keys and secrets: this does NOT mean that your tables are available anonymously.
  • Some assumptions were made in the wrappers which you may wish to change to better match your use case:
    • key values are unique in a table
    • update automatically adds a record if it’s not already there, and automatically removes duplicates
  • Characters such as apostrophes in the data fields will be interpreted as quotation marks and cause SQL errors: you’ll need to escape these to avoid issues.
  • About”) and column names to construct your queries

    via Ferris Argyle

The Art Of Google Maps

InstaEarth

Instagram is an exciting photography tool, but what really takes Instagram to the next level are applications like InstaEarth from Modea. InstaEarth is an easy way to search for and discover Instragram users and photos on a map. The application makes use of the Places API with Autocomplete to help users to search around a landmark or address. From InstaEarth, “InstaEarth is a way to discover and view beautiful Instagram photography taken around the world. View your feed, friends’ feeds, popular photos, or navigate the map and explore the world through the eyes of Instagrammers everywhere.”

TeleGeography – Submarine Cable Map

When you make a phone call or send an email abroad, most of the time that data travels by way of submarine cables. Submarine cables are the backbone of the global economy, so it’s fascinating to spend time exploring a map that shows where these cables are located. In addition to being a really interesting, fun, and a great looking map, this map is also technically savvy application. Each line representing a submarine cable is clickable and when selected grays out the other cables for better visibility. The map also uses Styled Maps to help the cables stand out better and Fusion Tables to help manage the data on the back-end.

DART St. Louis

There are two things I love to geek out on: maps and photography. That’s why I love this map from DART St. Louis. From their website, “In April 2011 over 250 creative St. Louisans gathered to throw darts at a huge map of the City of St. Louis. Participants then had one month to visit the area where their dart landed and make a photograph. The resulting collection of photographs shows a snapshot of St. Louis as it is today, one random block at a time.”

Berliner Morgenpost – Berlin Elections Map

This month we have yet another great map from Germany. Using Fusion Tables, Berliner Morgenpost mapped out the results of the September 2011 Berlin elections. Voting districts are colored coded by which political party received the majority of votes. Additionally, you can click on any one of the voting districts which will display an infowindow with a chart of the full voting results. This an excellent example of Google Maps API supporting the democratic process and bringing better transparency to government.

Dodge Journey Search

To promote the new Dodge Journey, Dodge is running a competition on YouTube where users can win one of three brand new Dodge Journeys. Video clues are released on YouTube to help users track down the secret location of the vehicle and if they find it, they own it. The clues are related to places in the real world, so users can rely on Google Maps and Places to help them figure out where the car is located. The Maps API serves as the hub of information for this competition and uses Styled Maps to match Dodge branding along with the Places API with Autocomplete to help users follow up on clues.

By Carlos Cuesta, Geo APIs Product Marketing Manager