The University of Wisconsin-Fox Valley


Dr. Andrew Shears is an Assistant Professor of Geography at the University of Wisconsin – Fox Valley, and this past semester he led a great project in his GEO 106 class – modeling the entire campus!

He first divided the campus into five sections for his 20 students to tackle, then set them to work. The end result is an excellent model of the campus that all of us will get to enjoy:


uw-fox.jpg 

The models have been submitted to Google for approval, though they aren’t yet showing up in the base layer of 3D Buildings in Google Earth. I’d expect to see them arrive in the next week or two.

Dr. Shears has written a very detailed blog entry that walks you through every aspect of the modeling process. It looks like it was a great class, the students learned a lot, and the resulting model is something that they can all be proud of!

Open Street Map Road Types For Display and Routefinding

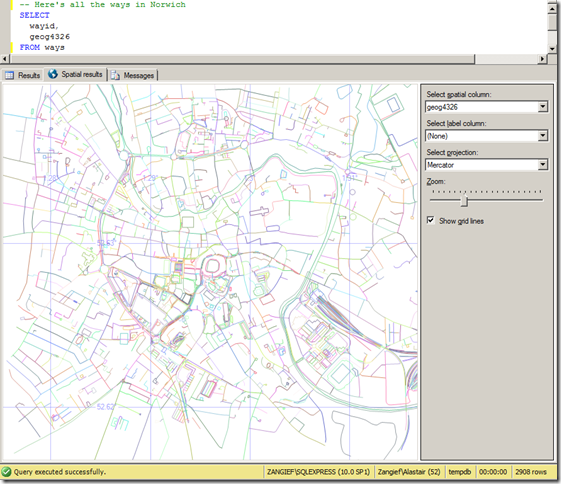
We displayed a set of ways imported from Open Street Map in SQL Server Management Studio. It looked like this:
image_thumb1

Now, as I stated previously, OSM ways don’t equate to roads. Ways can be any arbitrary series of nodes, so although at first glance it may appear to be so, the map above does not represent a roadmap. A single way may represent several roads, or only a single segment of one road. Many ways are nothing to do with roads at all – they may be rivers, or railway lines. Ways may also denote the boundaries of an area, such as a county, a park, or a building.

To create a dataset of OSM roads (or footpaths, tracks etc.) suitable for routefinding or display in a road map, it is necessary to retrieve only those ways that contain a tag element with a k attribute of “highway”. The corresponding v attribute describes the type of highway. Examples of possible values include:

  • cycleway
  • footway
  • motorway
  • path
  • pedestrian
  • primary
  • residential
  • road
  • secondary
  • service
  • steps
  • tertiary
  • track
  • unclassified

Note that this list isn’t exhaustive – the design of the OSM schema means that editors can tag ways or nodes with any values, but this is a list of some of the commonly-used tags.

There are many reasons why you might want to categorise each of these highway types separately.

  • Consider access for different modes of transport, for example; clearly, a car can’t go down a cycleway. Nor can a tractor go on a motorway, or a cycle go down steps (unless you’re planning some sort of stunt bike ride).
  • If you’re designing a route-finding application, you might want to consider and compare the relative costs of travelling down different routes. Motorway segments generally have a higher speed limit than primary roads, which in turn have higher average speed than secondary roads, etc. Therefore, a route that maximises the percentage travelled on higher-status roads may well be shorter in time, even if it covers a longer distance.
  • When drawing features onto a map, it’s usual to display different categories of highways with different styles (e.g. motorways coloured blue, primary roads thicker than secondary, tracks as dotted/dashed lines).

As a simple example, to style the Spatial Results tab view of my OSM map to show different categories of roads with different thicknesses I created a table to attach a weight to each highway type, as follows:


CREATE TABLE RoadWeights (
highwaytype varchar(32),
roadweight int
);
INSERT INTO RoadWeights VALUES
(‘motorway’, 15),
(‘motorway_Link’, 15),
(‘trunk’, 10),
(‘trunk_Link’, 10),
(‘primary’, 8),
(‘primary_Link’, 8),
(‘secondary’, 5),
(‘tertiary’, 3),
(‘residential’, 1),
(‘unclassified’, 0);

Then, I edited my SELECT query to only display rows from my Ways table that were tagged with one of my chosen highway types, and buffered the geography LineString representing each road by the corresponding weight from the RoadWeights table:

SELECT
w.wayid,
wt.TagValue AS highwaytype,
w.geog4326.STBuffer(ISNULL(roadweight,0))
FROM
ways w
INNER JOIN waytags wt ON w.wayid = wt.wayid AND wt.TagName = ‘Highway’
LEFT JOIN RoadWeights rw ON wt.TagValue = rw.highwaytype
WHERE
wt.TagValue IN (‘motorway’, ‘motorway_Link’, ‘trunk’, ‘trunk_Link’, ‘primary’, ‘primary_Link’, ‘secondary’, ‘tertiary’, ‘residential’, ‘unclassified’)

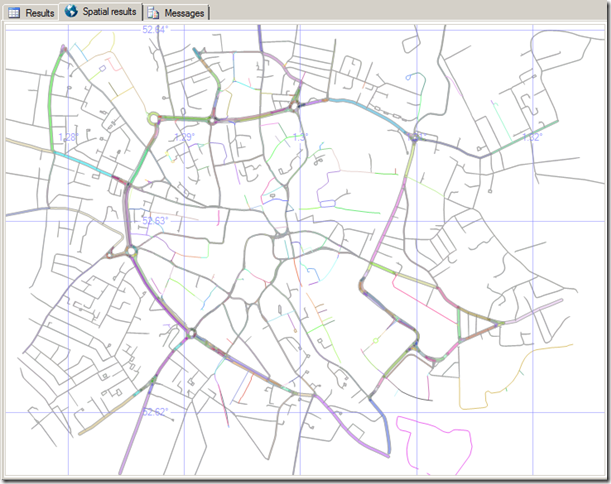
Even when viewed in the SSMS Spatial Results tab, the map already becomes much cleaner than the result shown at the top of this post – with the Norwich inner ring road and its primary arterial roads now clearly visible (and also, the train tracks coming into the railway station on the south east of the city are no longer shown)
Clearly you wouldn’t normally optimise your dataset just for the purposes of display in the SSMS spatial results tab, but you can apply this same technique to attach any other properties that correspond to the type of road – the average road speed limit, accessibility, or styling options that should be passed to a front-end display, for example.


Bing Maps – Data Connector – SQL Server

Bing Maps – Data Connector is an Open Source + Open Data project focused on connecting the power of Bing Maps Silverlight Control to the spatial query capabilities of SQL Server 2008.

Bing Maps Data Connector SQL Spatial
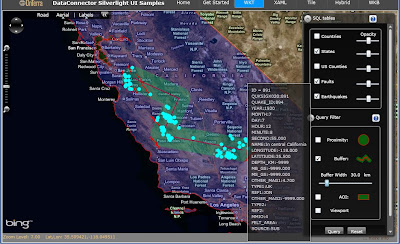
The Live Example – Finding Earthquakes using a user defined Buffer.
Solid Red line is Line to be buffered, green is the buffer, cyan is individual earthquake and associated attribution (date, size, duration).

The three basic parts of this project are the DataBase (SampleGeographyData), the WCF Services (DataConnectorWCF), and the Silverlight Client (DataConnectorUI2). The DataConnectorWCF and DataConnectorUI were developed using Visual Studio 2008 and the data base requires SQL Server 2008.

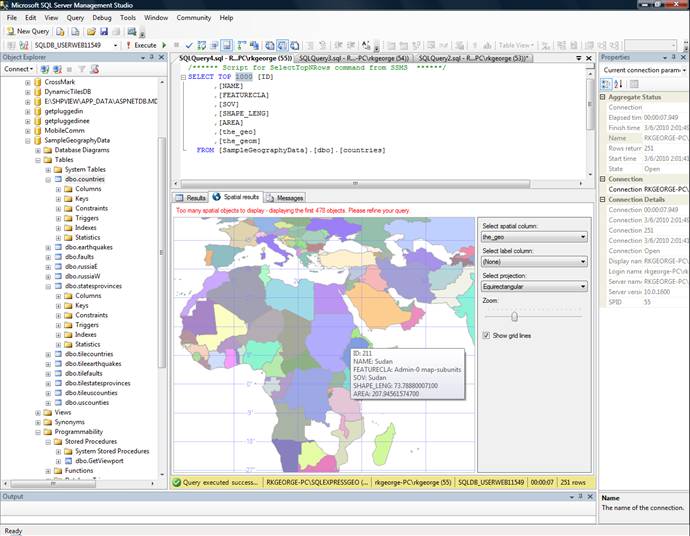
Bing Maps -  Data Connector - SQL Server 2008 Query
Bing Maps – Data Connector – SQL Server 2008 Query
These datasets imported to SQL 2008 were chosen to provide useful common data resources as well as examples of each type of spatial feature: points, lines, and polygons.

Additional data resources are easily added to SQL Server. The import utility used for this project was FME Translator from Safe Software.
http://www.safe.com

The data was imported as spatial type geometry and then corrected as required to make valid before updating to an additional geography spatial column. EPSG:4326 is the SRID used for all tables and constraints were added to enforce this srid. The end result is two spatial columns, “the geo” as geography, and “the geom” as geometry. Once imported the data was modified to include an “ID” column suitable for use as a primary key necessary for spatial indexing. For the sake of uniformity each table was also modified as necessary to provide a ‘NAME’ column. For the thematic polygon example an ‘AREA’ column was added to each of the polygon tables. Finally, spatial indices were added to the geography and the geometry columns.

There are lots of examples and blogs that explore Silverlight Mapping as well as resources for SQL Server Spatial. However, the WCF middle tier is not as well represented, which is the reason for publishing this project. The DataConnectorUI2 example Silverlight UI is a Navigation Project with examples of connecting to each of the sample WCF Services.

1. WKT example uses ‘Well Known Text’ to transmit SQL query results to the client.
2. XAML example transforms SQL query results into XAML, and then transmits as a XAML MapLayer.
3. Tile example builds raster png images in 256px x 256px tiles from the SQL query results. Tile Service feeds these to the client as MapTileLayer.TileSources endpoints. Tile has examples of both cached tiles and dynamic tiles. The th
ematic option will build dynamic tiles, otherwise tiles are cached in SQL Server as acquired.
4. Hybrid example combines tiles and XAML. Lower zoom levels use tile service for better performance with large data sets while higher zoom levels switch to XAML service to take advantage of vector interactivity.

Live Example : http://silverlight.onterrasys.com/dataconnectorUI/#/WKT