Google Apps

This week we have news from the Gmail and Google Docs teams, which both made interface changes to streamline how you use those applications. We also introduced some new keyboard shortcuts and made improvements to spreadsheet charts and functions.

New preview pane in Gmail Labs

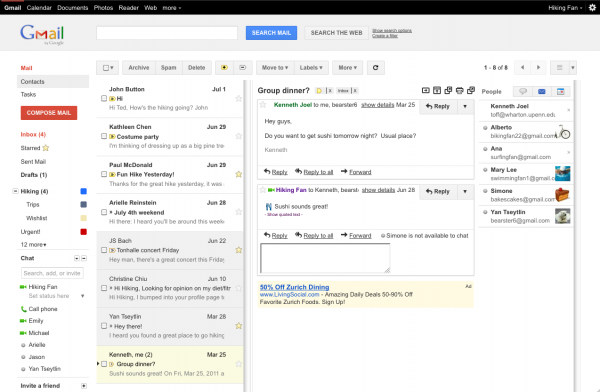
The Gmail team has heard requests from many of you for an inbox preview pane, and last Thursday we introduced this option as a Gmail Lab. Now you can quickly scroll through a list of messages and see their contents, marking mail as “read” as you go. Once you enable this feature from the Labs area in Settings, you can choose between a vertical or horizontal split in your Gmail window.

Sharper, smoother Gmail mobile interface

Last week we also brought a higher-resolution Gmail interface for people who access their inbox through a mobile browser on a high-resolution display, like the iPhone 4. We also simplified the process to check for new mail—just pull down on the Message List. Transitions between different pages in the interface are also smoothly animated now.

New look and keyboard shortcuts for the documents list

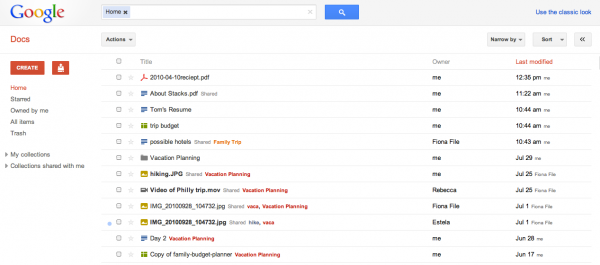
Google Docs also got some big interface improvements to the documents list last week as part of a Google-wide project to streamline and simplify many of our applications. You can switch to the new design by clicking “Try the new look” under the gear icon in the upper right. We’ve also added dozens of new keyboard shortcuts to navigate through the documents list, create new files, share items and more. Just type ? to see the keyboard shortcut cheat sheet.

Automatic spreadsheet function snippets

There are spreadsheet functions you probably know by heart, and others like GoogleTranslate where you might need a tip now and again, so on Tuesday we introduced spreadsheet function snippets. When you start typing a function into a cell, we’ll instantly show you a list of matching functions. Hovering over a function displays its proper syntax and the function’s purpose. We hope this feature saves you trips to the Google Docs Help Center.

New chart types, and chart improvements for documents and drawings

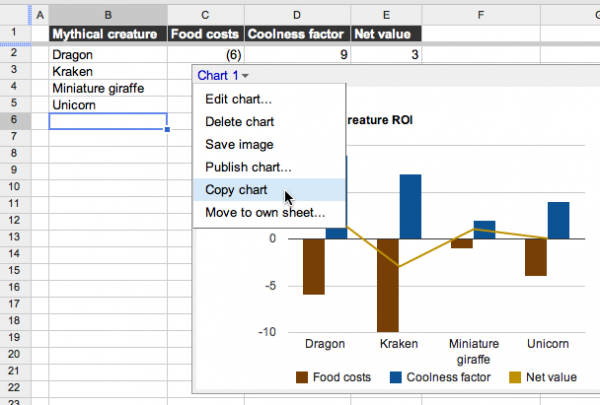
We also made spreadsheet charts more powerful and easier to work with. After you create a chart, it’s now simpler to copy an image of your chart and embed it into a document or drawing. There are more chart types to choose from now, too—from candlestick and combo charts to GeoMaps and TreeMaps.

Who’s gone Google?

At the end of July, we opened our doors in Japan to more than 1,500 business technology leaders from the region for a lively discussion about the future of business technology. At the event, we heard from Softbank Group, Casio, Nortiz and Toda Corporation, who have all decided to switch to Google Apps from their legacy solutions. More than 60,000 other businesses around the world also switched to Google Apps since our last update here too, including Cox Schepp, Journal Communications, Crown Partners and ITV.

In the government sector, we were pleased to see that the U.S. General Services Administration completed their transition of 17,000 employees and contractors to Google Apps, an impressive feat considering it’s been just six months since they decided to “go Google.”
Free data a GFC casualty

The US government has been a proponent of free data for quite a while now and over the years it established a number of national programs to allow easy access to wast resources of public information. However, the annual budgets for e-government initiatives were slashed by 75% last month, putting in question the survival of such programs like data.gov (it is the repository for publicly available data that was promised as a platform to power software and analysis created by and for the public). Comments from federal CIO Vivek Kundra indicate that data.gov will not be shut down but “…there will be no enhancements or other development to address needs for improvement”. So, although the policy of free data remains unchanged, significant cost of delivering that policy may be its ultimate “undoing”.

Meantime, in Australia, the progress towards opening up government data vaults has taken another step forward. Earlier this week Australia’s Information Commissioner, John McMillan, unveiled eight new rules for Federal agencies to adhere to when considering the publication of government data. These rules are:

  • Open access to information – a default position,
  • Engaging the community,
  • Effective information governance,
  • Robust information asset management,
  • Discoverable and useable information,
  • Clear reuse rights,
  • Appropriate charging for access, [So, not entirely free access!]
  • Transparent enquiry and complaints processes

The Principles are not binding on agencies, and operate alongside legal requirements about information management that are spelt out in the FOI Act, Privacy Act 1988, Archives Act 1983 and other legislation and the general law.

Despite the launch of data.gov.au portal, there is no federal program in Australia to facilitate access to public data on a large scale (ie. the US style) and the onus so far is on individual agencies to manage the dissemination of public information in their possession. State and Territory governments are pursuing their own initiatives. This “piecemeal approach”, although slower in implementation, may prove to be a more sustainable model for enabling access to public data, considering the vulnerability of large scale initiatives to budgetary pressures of the government of the day in these uncertain times.

How to show and manage organizational data Webcast

You can join for a webcast that will demonstrate how governments—federal, state, and local—are empowering their constituents with access to organizational data in captivating interactive data visualizations. The webcast will air on Wednesday, June 8, at 1:00 P.M. Eastern Time.

RetailAnalyzerVF5

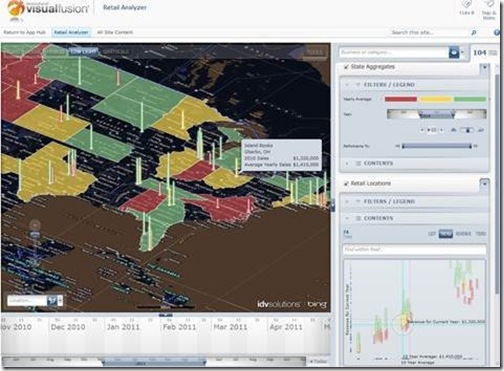
During the webcast, special attention will be paid to how public sector organizations are turning SharePoint into a geospatial business intelligence engine to gain clearer understanding more quickly, make better decisions faster, and keep their citizens safe. The webcast will offer live demonstrations that show how organizations of all sizes are leveraging the geospatial and time attributes of their data to unite enterprise content, relevant web feeds, mobile device inputs, images, and more into a single view, resulting in speedier decisions, more efficient use of resources, and reduced overall spend.


While everyone is invited to attend, you should definitely attend if you are a:

•    Program manager
•    GIS professional
•    IT professional
•    Anyone looking to make their data available to a wider audience

Presenters:
•    Matthew Pietryszyn, GIS Coordinator, City of Brampton, Ontario
•    Jim Keenan, VP of Government Sales, IDV Solutions