The British Picnics Map

Great British Picnics Map

Great British Picnics Map
Search and select picnic sites across the UK by environment or activity.

The Guardian newspaper (&partners) have produced a useful Google Map on Picnic
The newspaper and lastminute.com to ideas where to picnic. They have also worked with Enjoy England to create a Google Map based guide to great destinations in the .

The Guardian has now partnered with Country Life Butter to create a Google Maps guide to great picnic spots in the England, Wales, Scotland and Northern Ireland.

User and can search for a picnic sites or by activity, for example spots that are good for hikers, cyclists, bird watchers etc. Searches can be environment, such as by beach, riverside or country park.

Google maps: Travelers Great Maps

If you’re looking for some help to plan your next vacation, luckily there are some new sites to help you decide where to go, how to get there, and what to do once you’re there. Gone are the days of tedious library research, transportation schedule matching, and needlessly getting lost. These applications can do it all for you.


Rome 2 Rio


Rome 2 Rio is one of the most exciting new Google Maps API applications. Start by entering any two end points in the search fields and Rome 2 Rio will give you a list route options that include flights, trains, ferry, and driving directions. When you select a given route, the site allows you to view the details of each leg plotted out on the map and also gives you pricing options for flights. To learn more watch this video from Rome 2 Rio.


The Guardian – FCO Travel Advice Map


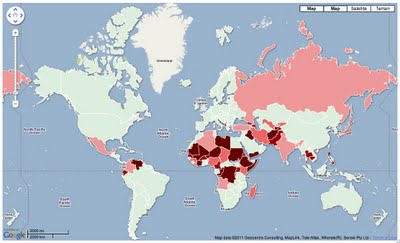
The U.K. Foreign & Commonwealth Office regularly issues travel advice for British citizens on the safest places to travel. Before you plan your next vacation, it might be worthwhile checking this map published by the Guardian that uses Google Fusion Tables to map out advice from the FCO. This map provides a fascinating snapshot of world travel.


Plnnr


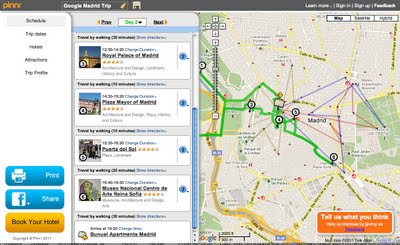
Plnnr is a one stop shop for travel planning advice. You start Plnnr by selecting a destination and length of stay. Then you select a theme (with kids, outdoors, popular, or culture experience), your level of intensity (more leisurely travel or ‘see everything’ travel), and your desired level of luxury. Based on these values, Plnnr builds a top to bottom trip itinerary complete with route maps, hotels, and attractions. You can print these plans out or share them with friends online. It’s a great tool to help you get a lay of the land before you even visit a new city.


Pitchup.com


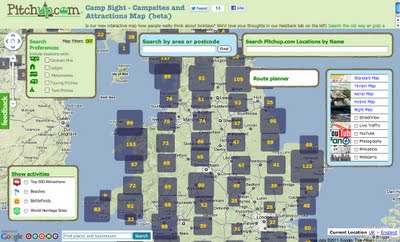
Pitchup.com is a new project to help U.K. campers find campsites or attractions and share reviews. The site has a wide range of tools to help your zero in on what you’re looking for. There are search tools for camping options (lodges, tents, trailers, etc.), layers of nearby photos and videos from Panoramio and YouTube, detailed information about each campsite, and much much more.


Sit or Squat


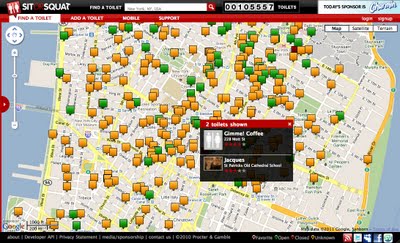
Ask anyone who’s spent significant time traveling and they’ll tell you one of the biggest difficulties on the road is finding a good public restroom. While you’re out and about, Sit or Squat makes this task easier by providing a list of over 105,000 open toilets from around the world. There are even pictures, descriptions, and ratings to help your decide where’s the best place to go!

Google Maps: The power of Fusion Tables with Dynamic Styling

The Fusion Tables Layer has been one of the most successful new features launched in the Maps API in the last year. We have seen a wealth of fascinating data visualizations that rely on Fusion Tables, such as the Bay Citizen Bike Accident Tracker and the WNYC Police Precinct map.

At Google I/O this week, Simon Rogers of the Guardian joined me and Kathryn Hurley of the Geo Developer Relations team to present some examples of how the Guardian uses Fusion Tables to visualise data for their readers, and introduce some great new features:

Fusion Tables allows you to share large tables of spatial data and render them on a map in a way that performs consistently well across all browsers, on desktop and mobile. The way in which the data is styled on the map, the markers used for points, the colours and stroke widths used for polylines and polygons, can be defined by the owner of the table in the Fusion Tables application, or using the new Fusion Tables Styling and InfoWindows API. However only the owner of the table can define the styling in this way, and styling for any single table is fixed.


At Google I/O we introduced Dynamic Styling of Fusion Tables layers. This allows the styling rules used for displaying a table in a Maps API application to be defined from JavaScript, and changed dynamically. For example you can use this to switch between rendering different data sets in the same table, or giving users control over which subset of the data is highlighted, as in the below example based on a public table of Chicago Homicides data:


In order to ensure the continued reliability of the Fusion Tables layer, we are also introducing some limits on the number of layers that can be used, and the complexity of styling. The Maps API now permits up to five Fusion Tables layers to be added to a map, one of which can be styled with up to five styling rules.

For information and code samples of how to apply dynamic styling to Fusion Tables, see our documentation, and for further assistance I recommend the Google Maps JavaScript API V3 forum. It’s great to see the creative ways in which Fusion Tables Layer is being used, and we hope this new flexibility will drive even more inspiring and informative Maps API applications.