Every day, we hear from customers around the world who are using Garmin products to explore more or just add a little fun to their everyday pursuits. We also receive stories about how our products have helped save or change lives. Recently, our in-house video team captured a few of these stories, straight from the customers. Hear howForerunner helped Jason discovered a life-threatening heart condition. How Garmin marine electronics helped Capt. Frank and his crew navigate stormy seas at night. How nüvi got Jeff to the hospital as he was having a heart attack. How Garmin avionics with Synthetic Vision technology guide organ procurement missions at all times of day and night, in all kinds of weather. And how our Rino two-way radio/GPS units help Heart to Heart International provide medical relief and humanitarian aid in response to disasters like the Haiti earthquake. Thank you to these individuals and our customers around the world for your faith in our products and for sharing your stories.
In the time since the tragic earthquake in Haiti 14 months ago, we’ve seen a variety of uses of Google Earth to help cope with the event in various ways.
Today we’re looking at how the Church of the Resurrection in Kansas City is using Google Earth to prepare for an upcoming relief trip to the country.
Last year, the church sent 15 teams to Haiti to help repair and rebuild various facilities including churches, schools, medical clinics, and more. However, the teams had a very difficult time communicating with their support systems in the US due to poorly-operating internet connections and wifi.
Last April, Clif Guy went down to help troubleshoot and repair/upgrade internet service in the Methodist guest house in Port-au-Prince so that subsequent teams would be able to stay in communication. During that trip and over the next 6 months he made major improvements and through the process learned a great deal about ISPs in Haiti and the challenges of dealing with intermittent service and intermittent availability of electricity.
This weekend he’s heading back down to Haiti to install network infrastructure and Internet connections in five Methodist buildings in the small town of Petit Goave, on the coast 42 miles west of Port-au-Prince. One of the five buildings is a school (College Harry Brakeman) where they will also be setting up a computer lab for use by high school students. Since Internet connections are very expensive in Haiti, it’s much more economical to install a primary and backup connection and then distribute the connections to the five buildings via radio links rather than purchase a separate connection for each building.
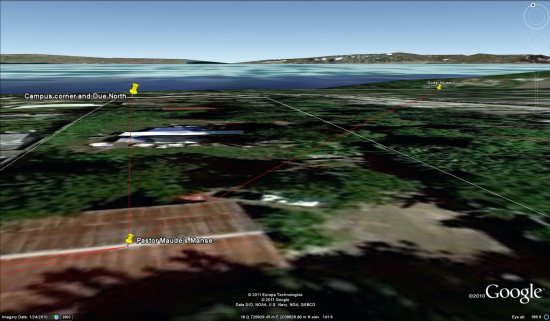
Working with a volunteer (retired manager from AT&T) who is their advance person in Petit Goave, they used Google Earth to mark the locations of the facilities that need Internet access. Once they had locations identified, they were able use Earth to perform a virtual site survey – distance between buildings, building elevations, terrain profiles along the paths between buildings, etc. in order to engineer a building-to-building wireless network. He chose a central location on the highest ground and with the best electrical power to be our network hub. Using Earth and some simple trigonometry he was able to select directional antennas that will allow them to establish the links from the hub to the other buildings with the minimum number of radios.
It’s an impressive piece of work. The files aren’t as complex as many that we’ve shown you over the years, but the simple fact that they were able to do so much planning from so far away because of Google Earth shows just how useful it can be.
If you’d like to view their plans in Google Earth, you can download the KMZ file here. Buildings are marked with yellow push pins. Radio links are marked with red paths.
VGI Background: There is a lot of discussion about Maps Crowdsourcing (or Volunteered Geographic Information – VGI) on the web at the moment. The excellent Geospatial Revolution clips are an example, this one discusses VGI as used by Open Street Map and Ushahidi in Haiti:
Note: Starts playing at relevant point in movie clip
I’ve just revamped a lecture for next week discussing VGI in depth and I wanted to get students to create and upload some VGI data but also to understand how to create a very simple VGI system. The solution was Google Fusion Tables.
Fusion Tables Background: For a while now I’ve heard Mano Marks amongst others pushing the geo capabilities of fusion tables (up coming where 2.0 example), this is the first time I’ve found an application for them. Neo-Geography is a term for all the new uses of interactive maps and map like visualisations appearing on the web, services like Google Maps, Google Earth are examples, they principally allow the public to visualise geographic data. What is so different about fusion tables is that they offer the ability not just to visualise but also to get into simple analysis of geographic data. Thus in Google Earth I can see Haitian refugee camps but with Fusion tables, it becomes easy to color code them by size. Fusion tables are also free and a lot more simple to operate than desktop GIS.
HowTo: Create VGI Thematic map: The following HowTo takes you through the steps of creating a database, uploading VGI data in the forms of polygons, defining a palette and outputting the result.
1] In GEarth digitise a number of polygons and give each of them a variable value (just 2 digits, no text) in the description box. E.g. I get students to digitise clumps of trees around Mt St Helens and give them a percentage tree cover value. Put all the polygons in a folder then save the folder as a KML file.
2] Go to the fusion tables site. If you do not already have a Google account you will need to set one up.
3] Click on File > New table > Import data > From this computer > Choose file, then upload your kml file. Click next then check the import columns include a ‘description’ column before clicking ‘next’ again to accept. Write a relevant description in the ‘Description’ box presented, then click Finish.
4] Your data should appear in a table with columns for description, name, and geometry. The Geometry column is the data Google Earth uses to draw each polygon, click on one of the kml labels to see the list of lat longs it uses.
5] Click on Visualize > Map. Your polygons should appear in a mashup using Google Maps, select ‘Satellite’ top right to see the true terrain. You will notice they are a default red at present. To create a simple thematic map we will apply a palette to the polygons colouring them a different colour depending on the percentage cover entered in GEarth.
6] Click on Visualize > Table to switch back to table view. Select Edit (on the menu bar) > Modify Columns > description > Type > Number > Save. This changes the percentages you entered in the GEarth description balloons from text to numeric values and you will see the description column right justify itself as a result.
7] Switch back to map view, now select Configure Styles (on the top of
the map) > Polygons, Fill colour > Buckets
Click the Radio button and on the pull down menu select 5 buckets. Select Column > description.
8] By default you have been given equal sized buckets (20% each), change them if you want. You should change the colours in the pull down menus on the right of the dialogue box to something appropriate. Click Save to apply this palette.
You should now see your palette displayed.
9] Now you have set up your VGI system, add others to the fusion table (share button top right of your fusion table web page > choose collaborators who can edit).
10] Get your volunteers to complete step [1] then access the fusion table and choose File > Import more rows to upload their own polygons.
 . Buildings are marked with yellow push pins. Radio links are marked with red paths.