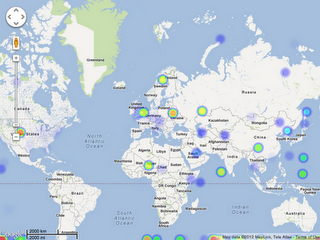
We’ve been talking a lot recently around the Maps Developer Relations Team about heat maps. Heat maps use colors to represent the intensity of occurrence or certain values. Heat maps are a popular way to represent data. People often ask me how to create them themselves. So the other day when I ran across heatmap.js, with it’s nifty Google Maps API Heatmap Overlay, I thought it would be perfect to share with you. Heatmap.js uses HTML5 Canvas to render the heatmap on top of the map. Apparently, it’s in early release, so feel free to help the developer, Patrick Wied out with some patches. Here’s what it looks like:
On another note, we recently announced that several college campuses are now available in Google Street View, in areas outside roads. That data is now available to you in the Google Maps API. Here’s the Quad at Stanford:
Finally, if any of you are going to be at Strata, Chris Broadfoot and I will be presenting a workshop there March 1st called Beautiful Vectors. Check it out or just find us and say hi.
via: GoogleGeoDevelopers