Bing Maps V7 Modules

The Bing Maps 7.0 Control was released last fall and is a complete rebuild from the ground up when compared to previous versions of Bing Maps. We have seen huge improvements in API performance and the size of the control. One feature of the map control is that it uses a modular framework, which allows you to register and load modular blocks of code as they are needed. This means that you are able to load in features only when they are essential, which results in faster loading speeds. Not only does this allow you to load in additional Bing Maps features and functionalities, but it also opens itself up for custom modules.

image

Creating a custom reusable module allows you to save time when making multiple applications since common blocks of code can be designed to be written so that they can be reused. By making code reusable, development time can be reduced. If the module is properly maintained it will also become better with time as bugs are fixed and optimizations added. But creating and maintaining a collection of modules may be a lot work for a single person.

Let us introduce the Bing Maps v7 Module CodePlex Project. This is a community site where people can share their modules for Bing maps. By having one central location for hosting these modules we make it easier for developers to find them and reduce the need to go searching through blogs for them. To date there are currently 4 modules that have been submitted for inclusion in the portal.

Module Name Description
Client Side Clustering This module allows you to easily add in clustering functionality into Bing Maps simply by using an extended version of the EntityCollection class called ClusteredEntityCollection.
Custom Infobox Control This module generates highly customizable infoboxes.
GeoRSS This module allows you to import GeoRSS files into Bing Maps. This module supports majority of GeoRSS and GML tags.
Simple GeoRSS This is a light weight module that can load a Simple GeoRSS feed to Bing Maps.

This project site also includes information on how to create and submit modules for inclusion in this site. If you have an idea for a module but are not sure where to start, add it to our list of module ideas here.
Discover Stories with New Microsoft Local Impact Map

Every day hundreds of nonprofit organizations are hard at work improving education, facilitating research, and giving people the skills to find work or start a business.  When a nonprofit really connects with its community it becomes more effective and it leads to thousands of incredible stories from every corner of the world – stories that help inspire even greater achievements.

At Microsoft, we want to help these nonprofits succeed. One way we can do that is to make it easier for them to tell their stories. So with that goal in mind, our Corporate Citizenship team has used Bing Maps to build theMicrosoft Local Impact Map, a new tool that allows you to discover the stories of the communities you care about most, stories about how people and technology are having a real impact.

LIM_06142011_main


One of our favorite stories comes from our team in India that worked with local teachers to train them under thePartners in Learning program. In the community of DharwadProject Shiksha was created by a group of trained instructors to establish a residential school for students with hearing impairments. One trainer in particular used an incredibly unique approach to help the students learn to use computers. Find out what she did by reading the story here.

LIM_06142011_story

Of course, this story is only one among thousands. The Local Impact Map provides a living record of how technology is having a positive impact in communities around the world. We invite you to take a look and read examples of people working together for a common good.

Round-up of all imagery and resources available for Japan Earthquake

We’ve written a few posts recently with information about Japan in the wake of their horrible earthquake and tsunami, but the data keeps pouring in so here’s an update on everything that is available to you.

On Friday, we listed all of the available resources, including Google’s very useful People Finder tool. On Saturday, Google started pushing out fresh imagery of the area, courtesy of GeoEye. Check out that post for the list of cities available.

Since then, they’ve also released imagery for Sendai and the surrounding area, which you can view using this KML file.

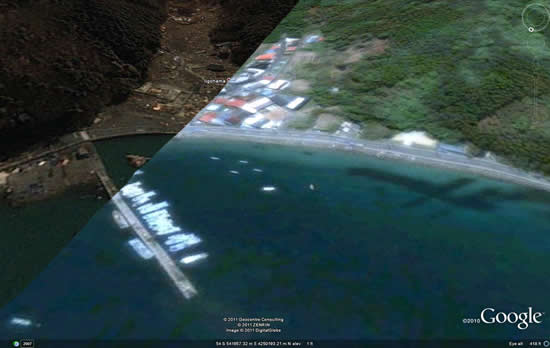
To make it easier to keep up with all of this new imagery, Google has created an all-in-one KML file that includes all of the various imagery updates. On top of that, they include some stunning before/after placemarks for areas that were hit especially hard. Here is an example:

ligohama.jpg

For easier viewing, those before/after shots can also be found in this Picasa web album.

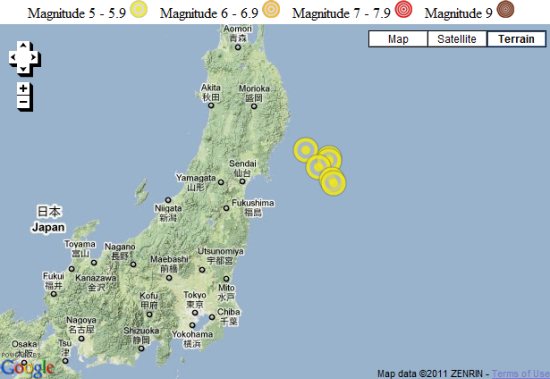
The LA Times has built an interactive timeline of the quakes.

la-times.jpg

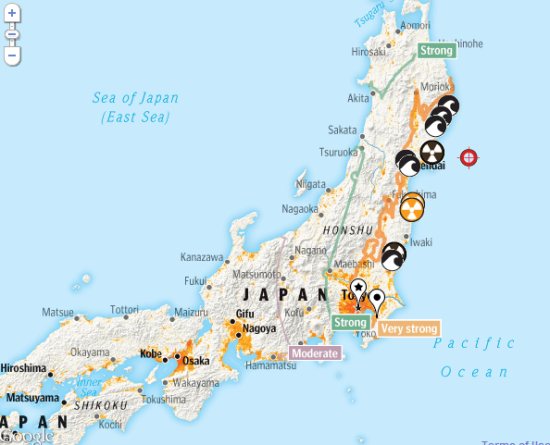
The Washington Post used Google Maps to show their “Wave of Destruction” map, highlighting some of the hardest hit areas.

wave-of-destruction.jpg

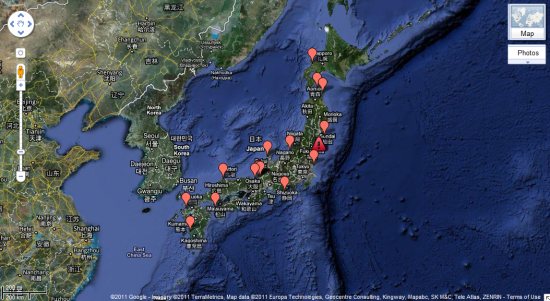
Harvard built a map to show the location of all of the nuclear sites in Japan.

harvard.jpg

Google Maps Mania also has quite a few more Maps-based resources listed in these two posts.

Finally, Google’s @EarthOutreach twitter account remains to be the best source for updated info/maps, so keep an eye on them.