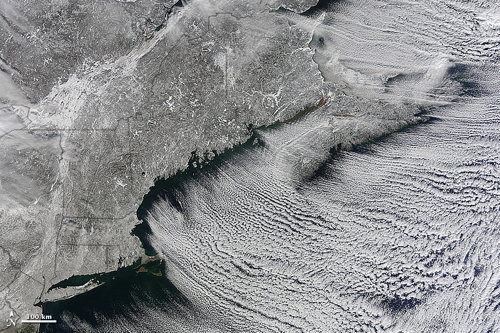
An eerily beautiful MODIS image of “cloud streets” across New England and the Maritimes from January 24, 2011. For another pretty image of winter from space, see this view of snow on the Korean peninsula.
An eerily beautiful MODIS image of “cloud streets” across New England and the Maritimes from January 24, 2011. For another pretty image of winter from space, see this view of snow on the Korean peninsula.
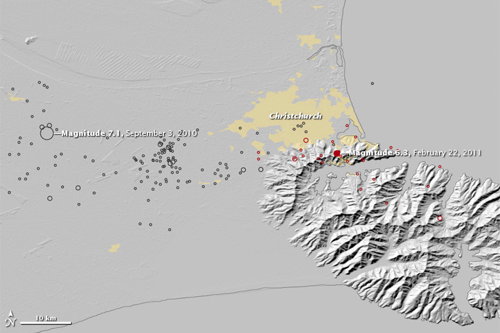
With this map, Earth Observatory connects the two major earthquakes to hit Christchurch, New Zealand:
This map shows the earthquakes that occurred near Christchurch since September 3, 2010. On that day a magnitude 7.1 quake struck to the west of Christchurch. Black circles represent earthquakes from September 3, 2010, until February 21, 2011. Red circles show the locations of the magnitude 6.3 quake and aftershocks on February 22 and the morning of February 23. Larger circles represent stronger earthquakes. Yellow shows urban areas, including Christchurch.
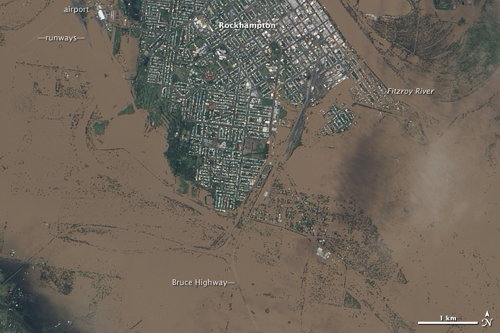
NASA’s Earth Observatory has a number of high-resolution satellite images of the floods in Queensland, Australia.
Nearmap managed to get an even closer look at the flooding, with two-centimetre-resolution imagery taken on January 13 and 14. ABC News (Australia) has a very neat infographic where you can slide between photos of the flooded areas and photos taken before the flooding. Flood imagery is available directly on Nearmap’s website, where you can select aerial imagery by date for comparison. More on the Nearmap images from the Brisbane Times. Via Google Maps Mania, @HodderGeography and Slashgeo.
Via Google Maps Mania: Above Photography’s aerial photography of the floods.
Google also has some map resources. Some links from Google Maps Mania.