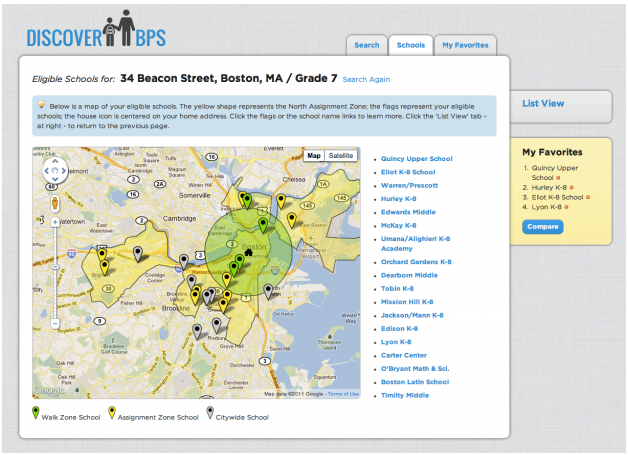
Every year in Boston, parents navigate the school selection process in an effort to get their kids into the best possible public schools. The process is complicated, and, depending on the outcome, can leave parents feeling frustrated and confused. DiscoverBPS was designed to make the process more intuitive, and to help parents make better choices for their kids.
Iteration #1 – Geocoded Addresses
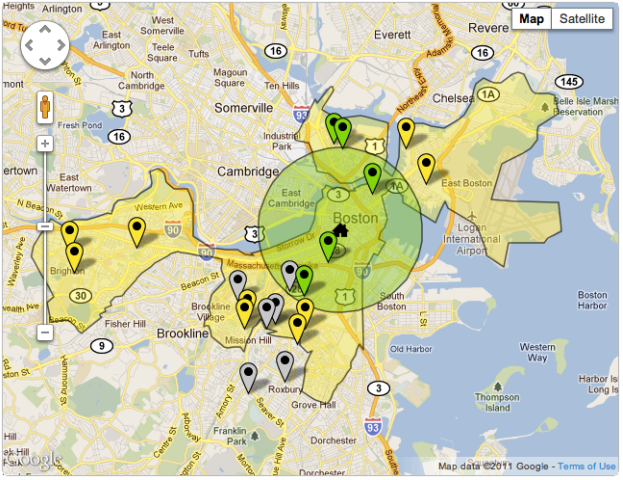
In our first iteration, we used a home address and grade level to identify a student’s eligible schools, and then displayed the results on a map. In the screenshot below, the green circle represents the student’s “walk zone” (in this case, a 1.5 mile radius appropriate to a 7th grade student), the yellow polygon represents the North Assignment Zone, and the markers represent the schools.
With a little help from Google’s Geocoding and Maps APIs, we seemed to be well on our way!
On closer inspection, however, we noticed one school that fell just outside of the walk zone boundary, even though – after zooming in and switching to satellite view – the school campus was clearly overlapping with the walk zone:
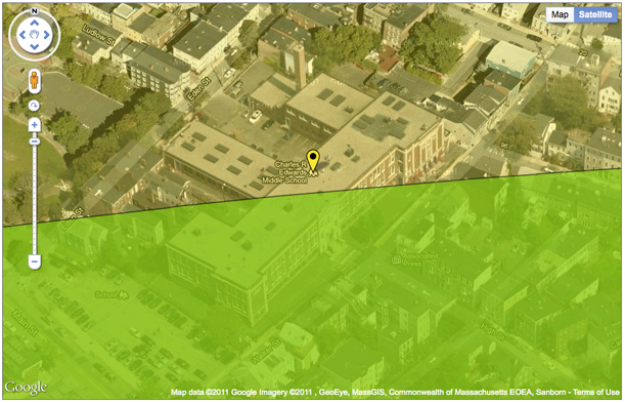
Obviously, if our goal was to build a tool to make the process more intuitive, we needed to avoid introducing new ambiguities into the system.
Iteration #2 – School Parcel Shapefiles
To solve the overlap issue, we obtained shapefiles for all of the City’s school properties, and used a PostGIS-enabled database to calculate distances between the home address and the nearest point on the school parcel. In so doing, we were able to calculate walk zone distances, which allowed us to properly identify schools with walk zone eligibility:

After a several weeks of deep-diving into the internals of PostGIS mapping, we seemed to be back on track.
Stepping back, however, a new consideration came to light: was it fair to assume that a 7th grader could walk from downtown Boston, across the Charles River, and to a school in Charlestown in less than 1.5 miles? A Google Directions search suggested otherwise (the route below is estimated at 1.9 miles):
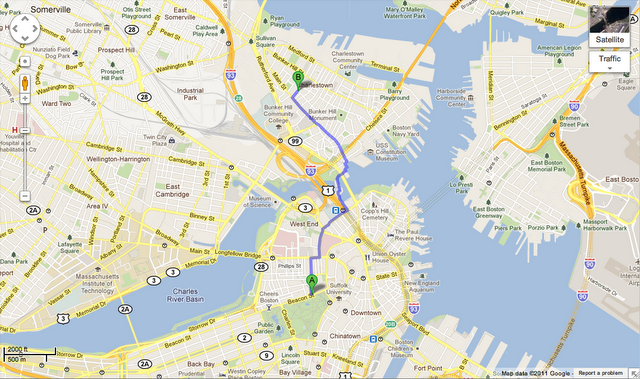
If the purpose of the walk zone policy was to determine which schools a student could reasonably get to on foot (and to discourage parents from busing their kids to schools on the other side of town), our walk zone circle began to seem misleading.
Iteration #3 – Walkshed Mapping
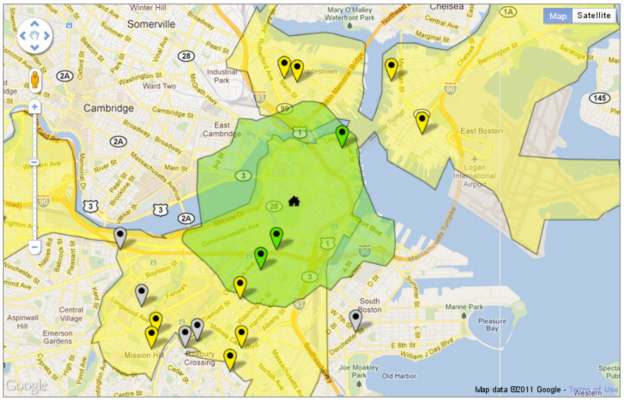
In the end, we decided to use an open source project called pgRouting (which extends PostGIS to provide geospatial routing functionality) along with OpenStreetMap to derive a “walkshed” polygon and to calculate street walking distances. We also could have used the Google Maps Distance Matrix API to calculate walking distance, but opted to go with pgRouting based on the need to create the walkshed polygon. These tools allowed us to then visualize the walkshed in Google Maps:

Aside from being noticeably smaller than the walk zone circle, the walkshed conveys a representation of walkability that is customized to the home address. Notice how the walkshed area is confined by bodies of water that are not spanned by any bridges.
DiscoverBPS is now live at www.discoverbps.org. The walkshed map (which would require policy changes by Boston Public Schools) is being considered for use in 2013.