Google Maps: WA housing affordability index

Bankwest has just released a report on housing affordability in WA. Bankwest’s affordability index is a ratio of average house price in a Local Government Area to average worker’s salary. Index values are ranging from 0.9 for Mount Magnet to 49.9 for Peppermint Grove (5 is the upper limit of what is considered “affordable”). The information has been presented in WA Today as an alphabetical list of LGAs with corresponding index value. The paper concluded that workers (defined as a group consisting of police officers, nurses, emergency workers and teachers) “…need to move to Perth’s extremities – or even out of it” to find affordable housing.

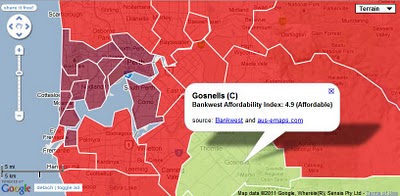
This is a good example where information could be presented in a more visually attractive and more informative way – using maps! I have converted Bankwest index table to a thematic map to illustrate how this information could be presented to highlight regions which are still considered affordable.

The key to creating an informative thematic map is to pick the right method for dividing values to be mapped into meaningful categories that convey a certain message. In this case, the story is about locations which are considered affordable. The bank has already defined affordability cut-off value as 5 so that information should be preserved and conveyed on the map. There are many statistical approaches to decide on the split of data to create meaningful categories but on this occasion a simple “rule of thumb” approach is sufficient.

There could be just 2 categories – affordable and non affordable – to convey the message adequately. However, since two-colour map would be quite boring, we could also try to highlight “tail ends” of the data, that is cheap housing areas (eg. those with index value of 2 and below) and those totally out of reach (with index value of 10 and over). The values picked to define the two additional ranges are totally subjective but it does not detract from the key message – that is, which locations have affordable housing.

The selection of colours to present the information on the map is also important. I opted here for a combination to convey the message that there are two categories (affordable and non affordable) but also to indicate grading of index values from “low” to “high”.

Concluding, my appeal is, whenever you think about releasing information relating to postcodes, suburb or other spatially defined regions, please consider putting it also on an interactive map to create a bigger impact! And use my free reference map to enable easy sharing of the information for even greater impact!
Why maps are still a niche

Two things crossed my mind. The first issue is that online maps are still not easy to share. Not to mention the challenge of creating and publishing them! All in all, there is not enough good content in shareable format to go around. Google is trying hard but despite, it is not easy and straightforward for anybody to use MyMaps and/or Fusion Tables to create informative maps for sharing. It is also not easy to find user created content, either on MyMaps or via filetype:kml search on Google. Indeed, I am struggling to find content for my reference map – with a few exceptions, like for example USGS earthquakes, there is virtually nothing immediately useable! Flood affected areas in NSW – zero. Fires in Israel – one… You get the picture.

True, there are some nice examples of map creation services but they are not quite yet up to the task – either too clunky for portability (eg. built with Flex requiring a hefty download to run) or can only be viewed on a specific site, or if embedding is allowed, show only a single map at a time. And since there are no communities like YouTube for sharing maps, again with exception of a few tiny by web standards portals, there are no critical mass to “make maps go viral”…

The second problem, as I see it, is that the spatial industry participants are looking too much inward rather than reaching out to the broader community. The focus is on selling software, data, services and solutions to fellow professionals and not much effort goes to providing tools for “solving problems and improving lives” of citizens in general. So, beyond a few specific applications, like online street directories or GPS navigation devices, and maybe a few more location aware tools, “doing thing the spatial way” does not have much broader appeal. Majority of people just don’t associate “information” with maps – rather only with text, lists or tables, eventually graphs. An example from the last few days – there are many road closure announcements due to recent flooding but try to find this information presented on a map. Not a chance! Yet without a reference to a map/ street directory/ road atlas, information like “…X road closed between Y junction and Z road” is completely useless for most.

Don’t get me wrong. Google did tremendous job with Google Maps, introducing masses to something otherwise considered a kind of a “black art”. Many valuable and community focused initiatives have been started in the last few years and individual professionals are doing tremendously important job creating, analysing and disseminating spatial information and maps but, as mentioned in the first point above, still much more work needs to be done to make spatial technologies and information widely understood and easy to apply. I hope that my reference map concept can contribute to that objective in some way.