I’ve just loaded the Ordnance Survey “OS Locator” dataset (part of Ordnance Survey Open Data) into SQL Server 2008. OS Locator contains details of all the roads in Britain, in a gazetteer-style format. It is a 120Mb delimited text file, containing details of around 790,000 road entities (some roads are split into multiple entities if they cross districts etc.) – including the road name, the coordinates of its bounding box and centrepoint, classification, and the county and area in which it is located. (Note that this dataset doesn’t include the geometry of the shape of the road itself). You can find the technical specifications for the OS Locator dataset here: http://www.ordnancesurvey.co.uk/oswebsite/products/oslocator/docs/user_guide.pdf
Since the file is text-based, there’s a range of options available to import it – you could create an SSIS package, or use the import/export wizard, or one of a variety of third party ETL tools. However, for an absolutely dead-easy way to query the data and create a geometry point representing the centre of each road using purely T-SQL, I used the OPENROWSET bulk function in conjunction with a format file.
Not only is this method easy, but it’s utterly repeatable so (assuming the structure of the source data remains constant) you can run it again each time the underlying data gets refreshed. OPENROWSET allows you to query the text file source directly, as if it were a table in the database, from which you can SELECT columns of data, INSERT them into other tables etc.
The following shows the xml format file I used to specify the columns of data in the OS Locator file:
[php]<?xml version="1.0"?>
<BCPFORMAT xmlns="http://schemas.microsoft.com/sqlserver/2004/bulkload/format" xmlns:xsi="http://www.w3.org/2001/XMLSchema-instance">
<RECORD>
<FIELD ID="0" xsi:type="CharTerm" TERMINATOR=":"/>
<FIELD ID="1" xsi:type="CharTerm" TERMINATOR=":"/>
<FIELD ID="2" xsi:type="CharTerm" TERMINATOR=":"/>
<FIELD ID="3" xsi:type="CharTerm" TERMINATOR=":"/>
<FIELD ID="4" xsi:type="CharTerm" TERMINATOR=":"/>
<FIELD ID="5" xsi:type="CharTerm" TERMINATOR=":"/>
<FIELD ID="6" xsi:type="CharTerm" TERMINATOR=":"/>
<FIELD ID="7" xsi:type="CharTerm" TERMINATOR=":"/>
<FIELD ID="8" xsi:type="CharTerm" TERMINATOR=":"/>
<FIELD ID="9" xsi:type="CharTerm" TERMINATOR=":"/>
<FIELD ID="10" xsi:type="CharTerm" TERMINATOR=":"/>
<FIELD ID="11" xsi:type="CharTerm" TERMINATOR=":"/>
<FIELD ID="12" xsi:type="CharTerm" TERMINATOR=":"/>
<FIELD ID="13" xsi:type="CharTerm" TERMINATOR=":"/>
<FIELD ID="14" xsi:type="CharTerm" TERMINATOR=":"/>
<FIELD ID="15" xsi:type="CharTerm" TERMINATOR="\r\n"/>
</RECORD>
<ROW>
<COLUMN SOURCE="0" NAME="Name" xsi:type="SQLVARYCHAR"/>
<COLUMN SOURCE="1" NAME="Classification" xsi:type="SQLVARYCHAR"/>
<COLUMN SOURCE="2" NAME="Centx" xsi:type="SQLINT"/>
<COLUMN SOURCE="3" NAME="Centy" xsi:type="SQLINT"/>
<COLUMN SOURCE="4" NAME="Minx" xsi:type="SQLINT"/>
<COLUMN SOURCE="5" NAME="Maxx" xsi:type="SQLINT"/>
<COLUMN SOURCE="6" NAME="Miny" xsi:type="SQLINT"/>
<COLUMN SOURCE="7" NAME="Maxy" xsi:type="SQLINT"/>
<COLUMN SOURCE="8" NAME="PostSector" xsi:type="SQLVARYCHAR"/>
<COLUMN SOURCE="9" NAME="Settlement" xsi:type="SQLVARYCHAR"/>
<COLUMN SOURCE="10" NAME="Locality" xsi:type="SQLVARYCHAR"/>
<COLUMN SOURCE="11" NAME="Cou_Unit" xsi:type="SQLVARYCHAR"/>
<COLUMN SOURCE="12" NAME="LocalAuth" xsi:type="SQLVARYCHAR"/>
<COLUMN SOURCE="13" NAME="Tile_10k" xsi:type="SQLVARYCHAR"/>
<COLUMN SOURCE="14" NAME="Tile_25k" xsi:type="SQLVARYCHAR"/>
<COLUMN SOURCE="15" NAME="Source" xsi:type="SQLVARYCHAR"/>
</ROW>
</BCPFORMAT>[/php]
Assuming that the format file above is saved as c:OSLocator_formatfile.xml, and the OS Locator download itself is saved as c:OS_Locator2010_2_Open.txt (the filename of the most recent locator download at the time of writing), then you can load the Locator dataset directly in SQL Server, creating a geometry point at the centre of each road in a single query as follows:
[php]SELECT *,
geometry::Point(Centx,Centy,27700) AS Centre
FROM OPENROWSET(
BULK ‘C:OS_Locator2010_2_Open.txt’,
FORMATFILE=’C:OSLocator_formatfile.xml’
) AS CSV;[/php]
And here’s what the data looks like:

Here’s the spatial results tab displaying the centre points of the first 5,000 rows of data:

And here’s what a small section of Norwich looks like having created a bounding box from the min/max coordinates of each road and overlaying them on Bing Maps (having first transformed the coordinates from EPSG:27700 to EPSG:4326):

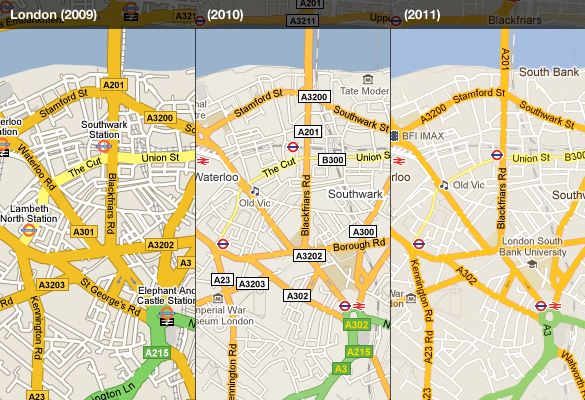
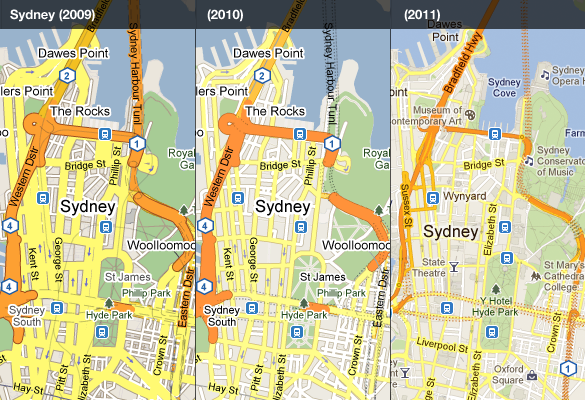
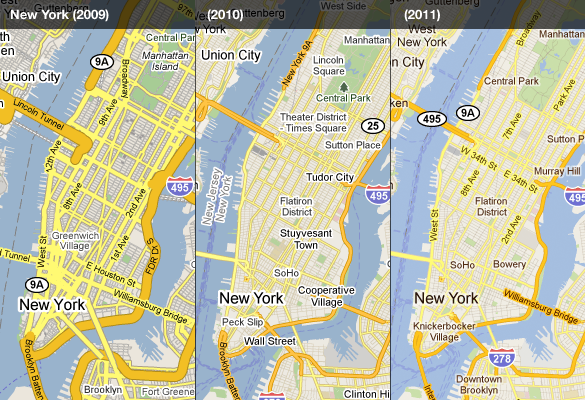 The visually heavy highway shields are now integrated into the road labels, and the brighter and cleaner style shifts the focus onto the road names and prominent landmarks in the area. London is one place that benefits from this: