NSW election map

Last weekend NSW voters went to the polls to choose the new State government. As was widely anticipated, coalition parties – Liberals and Nationals have won overwhelming majority of seats. The extent of Labor’s defeat can be best gauged by looking at a map which shows electorates coloured according to a winning party. Blue, traditional colour associated with the Coalition, covers almost the entire State of NSW, with only a few islands of red depicting Labor held electorates. The map was created by Sydney Morning Herald to report on the progress of election results.


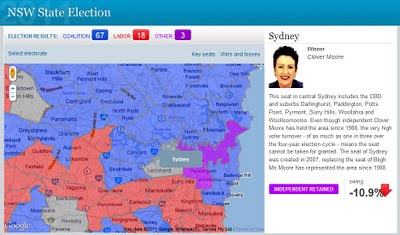
The map is quite intuitive to use – just move the mouse over the polygon to reveal electorate name and click on a polygon to bring additional information about the electorate in a side panel. As polygons are created from point data they can be highlighted on mouse over. The downside of this approach is that, because of the limit on how many points browsers can handle, developers had to sacrifice the quality of boundary outlines, keeping points to a minimum. The effects are gaps and overlaps in individual polygons when you zoom too close.

As noted in GIS related media, this was the only map used in reporting election results in NSW. Why this lack of interest to commit resources and present “the battlefield” spatially? I suspect that it may have something to do with the availability of State electoral boundary data – a quick search on the Internet did not yield any results. Creating such boundaries from secondary information sources may have proven too big of a task.

Google earth: Imagery Update (and Kansas Basketball)

We’re in the middle of college basketball Madness here in the U.S. and the best is yet to come. Tomorrow night, the Kansas Jayhawks will play the Richmond Spiders in a Sweet Sixteen match-up at the Alamodome in Texas. I’ll proudly admit that I’m a Kansas fan and hoping to see my home team make it to the Finals. But I’m not the only college hoops fan at Google. In fact, our Geo team put together a special page that shows an up-to-date schedule with schools and stadiums.

In our latest imagery push, we (coincidentally) added new imagery of Lawrence, Kansas and a new 3D model of the Allen Fieldhouse, possibly the best basketball venue on Earth. As a longtime Lawrence resident and KU alumnus, I still remember my first games in the “Phog” when I was in junior high school, watching from the upper bleachers. The Fieldhouse has aged well with the new Booth Family Hall of Athletics and the parking additions.


When I’m feeling like I need even more of a dose of home, it’s also great to be able to check out some of my favorite places back in Lawrence through Google Earth and Google Maps. With the new high-resolution aerial imagery, you can now see many changes including the updates to Memorial Stadium and the large practice fields.


Additional basketball-related updates include Gainesville (Florida), Tallahassee (Florida State), and Manhattan, the Little Apple (Kansas State [5]). We’ve also updated many other locations around the world that can be seen and discovered in our latest batch of published imagery including major updates in Sydney, Tokyo, Stockholm and significant parts of Ireland.

High Resolution Aerial Updates:
USA: Boca Raton, FL; West Palm Beach, FL; Port St Lucie, FL; Crystal River, FL; Ocala, FL; Gainesville, FL; Tallahassee, FL; Valdosta, GA; Savannah, GA; Jackson County, GA; Bedford County, PA; Cumberland County, PA; Manhattan, KS; Topeka, KS; Lawrence, KS
Wales: Northern Half
Scotland: Hawick
Japan: Tokyo; Kawasaki; Yokosuka
Australia: Sydney, Brisbane, Canberra

Countries/Regions receiving High Resolution Satellite Updates:
Antarctica, United States, Canada, Mexico, Cuba, Haiti, Dominican Republic, El Salvador, Panama, Bolivia, Paraguay, Brazil, Argentina, South Africa, Madagascar, Namibia, Zimbabwe, Zambia, Angola, Tanzania, Kenya, Burundi, Rwanda, Democratic Republic of the Congo, Uganda, Ethiopia, Sudan, Central Africa, Niger, Ivory Coast, Togo, Liberia, Senegal, Morocco, Algeria, Tunisia, Egypt, Israel, Jordan, Syria, Saudi Arabia, Bahrain, Qatar, United Arab Emirates, Kuwait, Yemen, Iran, Pakistan, Tajikistan, India, Bangladesh, China, Myanmar, Thailand, Taiwan, North Korea, Japan, Mongolia, Indonesia, Australia, New Zealand, Russia, Georgia, Armenia, Azerbaijan, Turkey, Greece, Bulgaria, Romania, Ukraine, Hungary, Austria, Poland, Croatia, Italy, Germany, Switzerland, France, Spain, Portugal, Ireland, Norway, Sweden, Finland, Greenland

These updates are now available in both Google Maps and Google Earth. To get a complete picture of where we updated imagery, download this KML for viewing in Google Earth.

Converting shapefile into KML

In the inaugural post in the Free GIS Tools series I presented Google Map API as a very powerful online GIS alternative. Google Map has the capacity to display spatial data in various formats but probably the most attractive option is its native support for KML/KMZ. It takes only one line of code to display complex spatial information on a Google Map – as long as it is in that format. True, not all KLM features are supported in Google Map but you can still create great maps using a single KML file. Try aus-emaps.com free map service to test how well Google Map handles KMZ files: Victorian bushfires aftermath, current earthquakes.

KML/KMZ is the only spatial data format directly supported by free Google Map and Google Earth desktop application. However, a lot of free spatial data is distributed in another very popular GIS format: shapefile (shp). In order to display that data in Google Map or Google Earth, it has to be converted to KML/KMZ format.

There are many tools available for download, or that are bundled with commercial software to do that conversion, but I found only one that really work for me. And the best thing is that it is totally free! It took quite an effort to find so, by sharing this information I hope to save you many hours of fruitless trawling through the Internet. Here are the details.

ESRI Shapefile to KML Converter by reimers.dk

Simple but effective desktop tool (it works!) available for free download. Just point to the shp file you want to convert, select attributes to include in description field and press a button to run conversion. The only limitation is that you don’t have a choice in selecting colours.

Here is an example of generated output: World Borders in KMZ (1.14MB kmz file draped on Google Map).

To reduce the size of KML file for distribution or deployment just gzip it. It is easy done using Google Earth “save as” function. That is, open your KML file in Google Earth and when you save it, it will be automatically converted to a compressed gzipped format with kmz extension.

For custom conversions from shp polygons to KMZ format, such as splitting a large file with many polygons into smaller files with individual polygons only (eg. to convert a single 60MB shp file with postcodes into 2,500 individual KMZ files), or grouping of polygons into custom areas (eg. to create sales or franchise territories by amalgamation of postcodes), or converting shp polygons into a thematic map layer (eg. by assigning colours to polygons based on specific attributes, like for example electorates by political party holding the seat), you will need more advanced tools. I can help you with those conversions for a small fee. Here is a sample of a thematic KMZ file using a selection of Sydney suburbs. I also have various polygon based data in KMZ format for immediate delivery (eg. postcode boundaries, as used in aus-emaps.com postcode finder service). Don’t hesitate to ask!

Use case example: Create outlines of polygons and show in an embedded map on a website (using collection of free tools and services available from aus-emaps.com)
Steps:

1. Define vertex coordinates of custom polygon area using simple geocoder tool from aus-emaps.com (select “Point” option and click on the map, reposition markers as required, copy to Notepad).

2. Convert a list of points in csv format to shp file format using instructions provided in a recent post titled “Converting csv files into shapefile”.

3. Convert shp file into KML using tools introduced in this post.

4. Convert KML file into KMZ format using Google Earth (open KML file and “Save As”…) [optional step]

5. Upload KML/KMZ file to your server and reference its URL address in an aus-emaps.com free map service.

6. Embed the map in you web page using HTML’s iframe element.

The process is a bit convoluted, I admit. You could take a shortcut by pasting latitude and longitude coordinates directly into KML “shell” but you will need the right template for this in the first place. Using Google Map’s MyMap drawing and embedding functionality is a simpler option but you will not be able to create complex polygons (eg multi-part and/or doughnut type).

I am currently working on a public tool to generate custom polygons from administrative boundaries in a few simple steps. Coming up in 2011! But I will also have to put some though into creating a dedicated KMZ generation tool so you can do it all from a single web page… added to the list of “Things to do!”.