Captain James Cook’s circumnavigation of New Zealand

Back in the mid-1700’s, Captain James Cook made a variety of discoveries around the world including the first European contact with the eastern coastline of Australia and the Hawaiian Islands. In addition, he recorded the first circumnavigation of New Zealand.

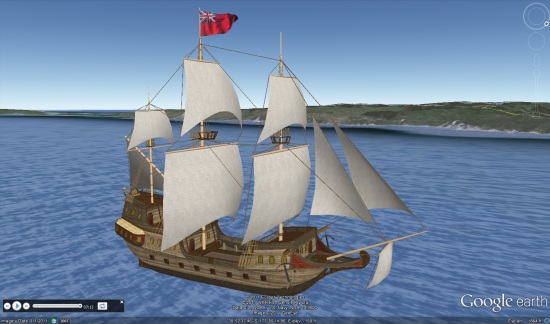
Colin Hazlehurst has put together an amazing tour of Cook’s circumnavigation, featuring an excellent 3D model of his ship, constructed by Phillip Müller.

ship.jpg

To see it for yourself, you can download this KML file.

Here’s a brief overview of Cook’s journey, taken from the KML file:

His Majesty’s Bark Endeavour sailed from Plymouth on Friday, 26Aug1768 with Lieutenant James Cook as Commander. The mission of the Endeavour was to boldly go…oh no that’s Kirk not Cook.

The first objective of Cook’s voyage was to observe the transit of Venus from the island of Tahiti in June, 1769, and after that to explore the Pacific with a view to determining whether or not there was a large southern continent.

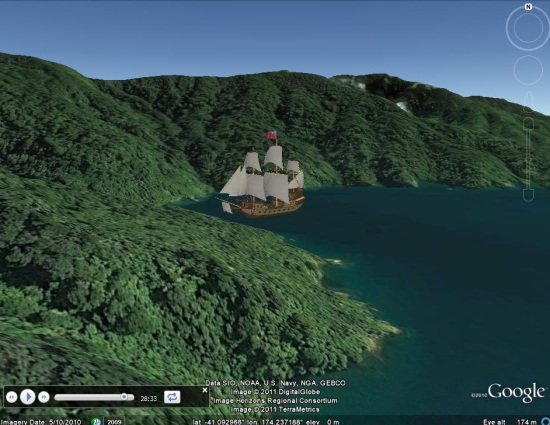
At 2 p.m. on Saturday, 7th October, 1769, land was seen from the masthead of Endeavour bearing west by north; this was the North Island of New Zealand and James Cook gave the order to stand in for it.

The ship anchored in Poverty Bay in the afternoon of 8th October, yet it took another four months to complete the circumnavigation of the island.

From Poverty Bay, Cook first took the Endeavour southwards along the coast as far as Cape Turnagain, where he decided it would be more fruitful to explore to the northwards. By meticulous observation of the sun, moon, and stars, Cook charted the coastline, noting the hazards to shipping and the places where there was safe anchorage and plentiful wood and water.

Always along the way, he tried to befriend and trade with the people he met, though not every encounter was successful. There were well-armed, warlike people who lived in strategically placed strongholds, but also friendly and curious people who were happy to trade fish and other seafoods for cloth and nails. Cook always regretted the taking of life, but sometimes it was necessary in self-defence.

He rounded East Cape on 31Oct1769 and made his way along the coast in a broadly north-westerly direction. He made extended visits to the Bay of Islands and Mercury Bay, this last so named because they observed the transit of Mercury, and so were able to fix the latitude and longitude of the bay to a high degree of accuracy.

It took more than 3 weeks to round North Cape, in the face of westerly gales, strong currents, and a broad swell. Cook found it impossible to land on the ‘dangerous’ west coast of North Island, finding no safe harbour or anchorage. He rounded Cape Egmont and made his way to Queen Charlotte Sound where the ship was careened and scrubbed.

After narrowly avoiding the small islands called The Brothers, Cook took Endeavour through Cook Strait and started to explore the east coast of South Island. However, to prove to his officers that North Island was indeed an island and not part of a larger continent, he took advantage of a favourable wind to complete the circumnavigation of North Island on 09Feb1770.

ship2.jpg

In Colin’s words, here’s how the file itself works:

This Google Earth presentation animates the 3D model of a ship as it follows the track of the Endeavour, and is accompanied by a reading of Cook’s journal. The circumnavigation of North Island is divided into sections which have significant start and end points. In Google Earth terminology, each section is known as a ‘tour’.

To play a given tour, first find it in the Table of Contents folder. You will see the name of each tour displayed as a hyperlink against a Folder icon, e.g. Poverty Bay to Cape Kidnapper. A single click on the hyperlink will display an information balloon which shows, for that tour:

• The start and end dates of the journey.
• The duration of the tour in minutes and seconds, being the length of time it will take to play the tour in Google Earth.
• Start a tour by expanding the Folder to show the Tour icon and the title ‘Play’ and double-clicking the icon.

via: Google Earth Blog

Real-time design with SketchUp


I especially appreciate that SketchUp allows me to model in real-time which is a feature I use in meetings with clients, stakeholders and other consultants on the design teams. A few years ago a colleague of mine, Gary Hartnett, started using SketchUp in meetings as a tool to both “wow” the client and to educate them regarding the possibilities and constraints tied to different design options.

This capability came in handy on a project we were working on with Community Transit in Everett, WA to design concepts for a series of Bus Rapid Transit (BRT) Stations. After our first workshop, we came out with a couple of concepts which we refined and presented using SketchUp. One of these concepts ended up being built as close as possible to the original design. By modeling and presenting in SketchUp, the client felt ownership over the design and had a better understanding of the challenges associated with construction. Initially, they wanted something “wavy” or “fluid”, but using SketchUp, it was effective to show that a two-directionally curved canopy is not terribly easy to build, especially with a limited budget and a tight schedule.


3 options developed for BRT stations. The bottom option was built in 2010. 

Later in 2007, we designed a Pedestrian Bridge in Tempe, AZ at the Town Lake. In meetings with the client, the engineer T.Y. Lin International, and the artist Laurie Lundquist, it was highly effective to present proposed concepts for the bridge directly from SketchUp using a laptop and a projector. This allowed the team to engage in real-time with the bridge concepts and study the relationship with the neighboring Tempe Center for the Arts, which was a sensitive issue for this design. The viewpoints at the different piers of the bridge were easy to visualize using a series of Scenes in SketchUp. The model also allowed real-time analysis of aspects like transparency, visibility and shading. I then created a rendering of the bridge using Adobe Photoshop, which was helpful in creating the reflection in the water.

SketchUp was also a great tool to do shading studies for consideration of different shading structures. A shading sail, developed together with local artist Laurie Lundquist, integrated with the flow of the bridge and proved elegant and functional.

Toward the end of the design process, SketchUp actually played one more unique role. While I was determining the right angle for the 2 bridge arches to touch each other at the top of each arch in SketchUp, the 2 arches suddenly overlapped (as I was working within the component, both arches were turning simultaneously), and voila, a unique crossing arch appeared, which we introduced as our preferred alternative. Today, the bridge is currently under construction.


A shading study 


The bridge under construction 

As recently as a couple of weeks ago, I used Match Photo for the first time in a meeting with a prospective client for station design and design of alignment options for another Bus Rapid Transit (BRT) line. I created just one model to demonstrate 3D modeling, show 3D sections of the streetscape and show a Match Photo context study.


Different configurations for street lanes 

By switching Layers on and off and clicking on saved Scenes, we were able to show how future transit oriented development (TOD) would positively impact the streetscape. The different lane options were also placed in different Layers and Scenes, so we could show their respective impact with one click on the Scene tab. At the request of the client I was able to change the station configuration in real-time, which translated immediately to the Match Photo Scenes.


BRT station renderings 

I want to conclude by saying what I appreciate most about Sketchup is that it’s highly intuitive and quick enough that it enables real-time modeling, which is a real asset in presenting and shaping public projects that usually include a significant amount of community engagement.

Google Maps: How Late Your Bus Is?

Waiting for your bus can sometimes seem like slowly dying in a desert as you watch vehicle-shaped mirages glimmer on the horizon. As a remedy for that transit-parched feel, Google is integrating live transit updates into Maps for mobile and desktop.


Before you get all excited, the update is only available in four U.S. cities (Boston, Portland, San Diego and San Francisco) and two European cities (Madrid and Turin), and for Google Maps for mobile on Android devices (although it will work on mobile browsers, and it doesn’t require any downloads to access).

Citizens of those cities will be able to see delays and alerts when clicking on transit stations or planning routes, as well as “live departure times.”