The New Normal Temperatures


NOAA Climate Normals: January Minimum Temperature (F): 1981-2010 vs. 1971-2000

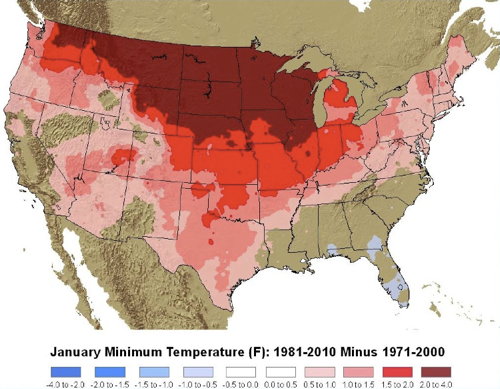
Whenever I see a weather forecast, it’s usually accompanied by normal temperatures for the day. In NOAA’s case, that normal is calculated from a 30-year average, updated every decade. NOAA just updated those norms, Dan Satterfield reports, and as you might expect, things are a bit warmer: “Climate change is expected to be stronger in northern areas of North America and that trend continues to show up. It is also expected to be more noticeable at night and in winter and that too shows up clearly,” Dan says. Here’s a PDF of the NOAA briefing deck explaining the update, from which the map above is taken: the map shows the increase in degrees Fahrenheit between the 1971-2000 and 1981-2010 normal minimum temperatures for January. Via MAPS-L.

Record Melt in Greenland in 2010

Record Melting in Greenland during 2010 NASA Earth Observatory has a map showing the record melt of Greenland’s ice cap in 2010, during which the melt started earlier and lasted longer than usual. “This image was assembled from microwave data from the Special Sensor Microwave/Imager (SSM/I) of the Defense Meteorological Satellites Program. Snow and ice emit microwaves, but the signal is different for wet, melting snow than for dry. Marco Tedesco, a professor at the City College of New York, uses this difference to chart the number of days that snow is melting every year. This image above shows 2010 compared to the average number of melt days per year between 1979 and 2009.”