How Google Earth is being used by the Philippine National Police


Over the years, Google Earth has been responsible for helping a huge number of non-profit and other worthwhile organizations around the world. We’ve shown you how environmental groups have been using Google Earth for more than six years, how it’s been used to fight against rainforest logging, and Google Earth Outreach consistenly showcases many other amazing organizations from a variety of countries.

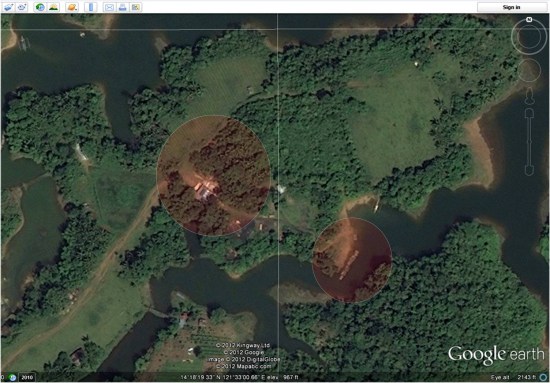
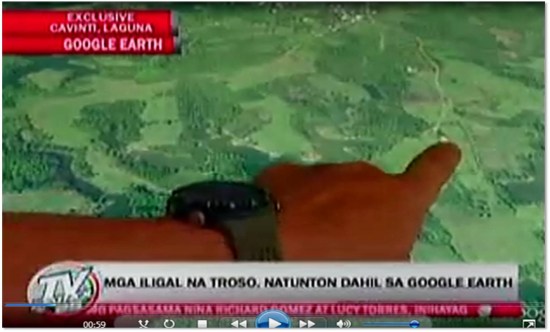
Similarly to the others that have used Google Earth to fight against deforestation, the Philippine National Police have been using Google Earth to fight illegal logging in the province of Laguna.


map2.jpg 

Here is their story, in their words:

On behalf of all the personnel of Philippine National Police (PNP) Laguna, I would like to express our gratefulness for the wonderful gift of your Google Earth services. It contributed a lot and it has been a great part of our efforts against illegal logging here in the province of Laguna. Nationwide, we are shocked by the effect of the natural and man-made calamities wreaking havoc to our country resulting to loss of lives and properties. Man-made calamities are greatly attributed to rampant illegal logging and deforestation thus causing flash floods and landslides. Since Laguna had been one of the most affected areas of flash floods and landslides, the Laguna PNP initiated the creation of a dedicated Provincial Anti-Illegal Logging Task Group “BERDE” purposely to ensure the implementation of OPLAN “BERDE (Boost Economic Reserves for the Development of Ecosystem). Through the help of Google Earth, we were able to locate specific targets of our OPLAN BERDE. Our operations yielded positive results on illegal logging sites like Cavinti, Laguna that was identified by using Google Earth. Initial operation last April 13, 2012 resulted to the recovery of forest products, machinery equipment, tools and conveyance abandoned during apprehension. Google Earth has been a major contributing factor to the success of our operation. Because of you and your innovative services, we can keep moving forward towards the attainment of our goals in the field of law enforcement.

As Google Earth imagery continues to become higher resolution and update more rapidly, it will become an even more useful tool for organizations like this one.


Picture4.jpg 


Armstrong on Pushing Through


Pain is temporary.
Quitting lasts forever.”

– Lance Armstrong (1971 – )

American cyclist

7-time Tour de France champion

cancer survivor

In 1996, Armstrong was 25 (and ranked the No. 1 cyclist in the world) when he was diagnosed with testicular cancer that spread to his stomach, lungs, and brain. Doctors gave him less than a 40% chance of survival.

Two years later, after a miraculous recovery, he got back on a bike but quit a race in Paris realizing he wasn’t ready (ironic given today’s quote).

The following year (and the next 6), he won the Tour de France and retired as the only person to win it seven times.

London Riots Map: Visualising correlations on maps

Correlation is a statistical technique very often used in data analysis. It can show whether and how strongly pairs of variables are related. It normally involves lots of mathematical calculations but a quick insight into the phenomenon under investigation can be gained by simply superimposing the data on a map, if both datasets have a common spatial component (eg. location).

Take, for example, a case of recent London riots, mapped on MapTube. Overlaying locations of civil commotions with Index of Deprivation (ie. a measure of poverty) allows drawing a hypothesis that poverty and propensity to violent demonstrations are related. The correlation may not necessary be obvious when analysing each dataset in isolation and in a numerical form.

A point to note however is that, if the two variables are said to be correlated they may or may not be the cause of one another. In other words, correlation does not imply causality. The correlation phenomena could be caused by a third, previously unconsidered phenomenon, called a lurking variable or confounding variable. For this reason, there is no way to immediately infer the existence of a causal relationship between the two variables. Hence, one should not jump to the conclusion that “poverty is a major factor contributing to London riots” without examining the phenomenon in more detail.

As a side note, I am very surprised to see so much “red” on the London map, implying that the majority of central suburbs are poverty stricken areas – with only a few pockets of wealth on the city fringes. This picture is in big contrast to Sydney where underprivileged areas are concentrated mainly in the south-western part of the city and, most importantly, account only for roughly a quarter of the overall metropolitan area. Australia indeed seems to be a very lucky country…

London Riots Map first spotted on Google Maps Mania