Australia Added New Colors to the Weather Map
Australia’s “dome of heat” has become so intense that the temperatures are rising off the charts – literally.
The air mass over the inland is still heating up – it hasn’t peaked
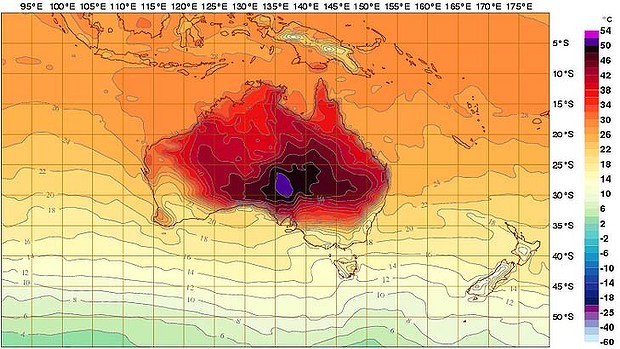
The Bureau of Meteorology’s interactive weather forecasting chart has added new colours – deep purple and pink – to extend its previous temperature range that had been capped at 50 degrees.
The range now extends to 54 degrees – well above the all-time record temperature of 50.7 degrees reached on January 2, 1960 at Oodnadatta Airport in South Australia – and, perhaps worringly, the forecast outlook is starting to deploy the new colours. Advertisement “The scale has just been increased today and I would anticipate it is because the forecast coming from the bureau’s model is showing temperatures in excess of 50 degrees,” David Jones, head of the bureau’s climate monitoring and prediction unit, said. While recent days have seen Australian temperature maps displaying maximums ranging from 40 degrees to 48 degrees – depicted in the colour scheme as burnt orange to black – both Sunday and Monday are now showing regions likely to hit 50 degrees or more, coloured purple. Clicking on the prediction for 5pm AEDT next Monday, a Tasmania-sized deep purple opens up over South Australia – implying 50 degrees or above. Aaron Coutts-Smith, the bureau’s NSW head of climate monitoring, though, cautioned that the 50-degree reading is the result of just one of the bureau’s models. “The indications are, from the South Australian office, that we are not looking at getting any where near that (50 degree level).” Still, large parts of central Australia have limited monitoring, so the 50.7 degree record may be broken. “The air mass over the inland is still heating up – it hasn’t peaked,” Dr Jones said. Australia’s first six days of 2013 were all among the hottest 20 days on record in terms of average maximums, with January 7 and today likely to add to the list of peaks. That would make it four of the top 10 in a little over a week. National record smashed And the country has set a new national average maximum of 40.33 degrees on Monday, beating the previous record – set on December 21, 1972 – by a “sizeable margin” of 0.16 degrees, Dr Jones said, adding that the figures are preliminary. “Today is actually shaping up to be hotter – and it could be a record by a similar margin,” he said. Another record to be smashed on Monday was Australia’s mean temperature. The country averaged 32.23, easily eclipsing the previous record – set on December 21, 1972 – of 31.86 degrees. Just 0.13 degrees separated the previous four highest mean temperatures, underscoring how far above average the day was. The scorching temperatures could last into the weekend and beyond, Dr Jones said, potentially breaking the country’s all-time high of 50.7 degrees. “The heat over central Australia is not going to go anywhere,” he said, noting that the northern monsoon and southern cold fronts have all been weak recently. “We know the air mass is hot enough to challenge the Oodnadatta record.” While the national data goes all the way back to 1910, the bureau views the figures are most reliable from about 1950. Before today, six of the 20 hottest days in Australian records have been in 2013 – with that tally likely to rise to seven out of 20 by the day’s end. Here are the rankings:
Hottest national averages on record (before today).
1 January 7, 2013: 40.33 degrees
2 December 21, 1972: 40.17
3 December 20, 1972: 40.01
4 December 22, 1972: 39.82
5 January 1, 1973: 39.79
6 January 6, 2013: 39.71
7 December 17, 2002: 39.7
8 January 2, 1973: 39.65
9 January 3, 2013: 39.55
10 December 16, 2002: 39.54
11 December 30, 1972: 39.48
12 December 31, 1972: 39.43
13 January 27, 1936: 39.4
14 January 1, 1990: 39.39
15 January 4, 2013: 39.32
16 January 5, 2013: 39.26
17 January 2, 1990: 39.22
18 January 2, 2013: 39.21
19 December 18, 2002: 39.2
20 January 13, 1985: 38.98
Source: Bureau of Meteorology
Bomb Sight interactive map – London Blitz
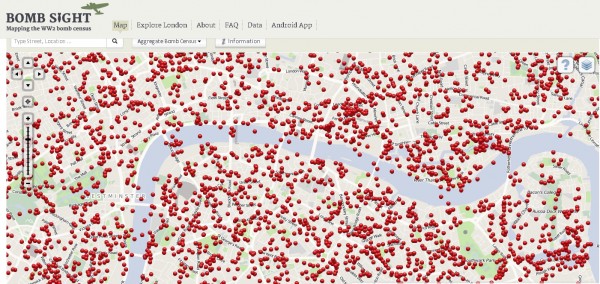
An interactive map showing the location of bombs dropped on London during World War II has been created.
It reveals the devastation caused by the Blitz over eight months.
The year-long project, called Bomb Sight, was devised by a team from the University of Portsmouth using data from the National Archives.
The website and android app also allow people to find out the types of bombs that fell.
‘Circle of fire’
Dr Kate Jones, the University of Portsmouth geographer who devised the project, said: “When you look at these maps and see the proliferation of bombs dropped on the capital, it does illustrate the meaning of the word Blitz, which comes from the German meaning lightning.
Users can zoom in to specific streets on the map, which uses red symbols to illustrate where each bomb landed.
The project was funded by education and research charity Jisc which offers resources and expertise to educational organisations.
More than 20,000 people were killed and 1.4m people made homeless during the Blitz, which took place between 7 September 1940 and 11 May 1941.
A spokesman from Bomb Sight said the project uses maps of the London bomb census, taken between October 1940 and June 1941.
The bombing locations were combined with geo-located photographs from the Imperial War Museum, and memories from the BBC’s WWII People’s War Archive.
Jisc programme manage Paola Marchionni said the project was “similar to a map sat-nav”.
She said: “The original Blitz maps have been scanned and geo-referenced thanks to the National Archive and testimonials from the BBC have been incorporated together with historical images from the Imperial War Museum to create an interactive teaching and learning resource.”
The website appeared to be experiencing problems due to high volumes of traffic earlier.
On 29 December 1940, air raids targeted the City of London, leaving the square mile in flames.
‘Such bravery’
Bombs rained down on St Paul’s Cathedral, which Prime Minister Winston Churchill said should be protected at all costs.
Volunteer firewatchers patrolled the cathedral’s corridors, using sandbags and water pumps to douse the flames.
The cathedral was saved but many more buildings were lost.
The Reverend Canon Mark Oakley, treasurer at St Paul’s Cathedral, said although made of stone, the cathedral also had a large amount of timber.
He said: “The brave 80 men and women who volunteered to be part of the St Paul’s Watch, after finishing their day’s work, helped save the cathedral from potentially devastating fires.

“The cathedral did suffer bomb damage but thankfully managed to remain a focus and encouragement to Londoners in their resistance to fascism.
“We must not forget Lieutenant Davies and Sapper Wyllie who removed an 8ft bomb from 27ft in the ground next to the cathedral without being able to defuse it,” he added.
“They drove the bomb to Hackney Marshes where it exploded and made a crater 100 feet in diameter.
“Such bravery is humbling for those of us who take too much for granted.”
In one of the bombing attacks, Felicity Edwards, who was 17 when the war broke out, was sitting with her mother in the kitchen of their home in Balham, south London, in October 1940 when a bomb fell in the High Road and through the roof of the Underground station on to the Northern Line.
More than 60 people were trampled and killed as they tried to escape.
The next day, Felicity saw a double-decker bus stuck in a crater on the High Road. The driver is believed to have driven into it in the dark.
via: BBCNews


