It’s been an exciting past few months in the Google Chrome Developer Tools world as we keep adding new features, while polishing up existing ones to respond to your feedback.
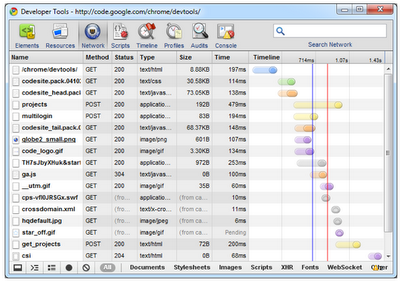
One of the areas we have focused a lot of our energy is on network instrumentation. Recently we’ve made many improvements that will hopefully improve your experience when using Chrome Developer Tools. These improvements include:
- Network aspects of your web page are now inspected in the Network panel. This gives you access to even more information at a single glance. You can sort and clear data, preserve log information upon navigation and even export network data into HAR format.
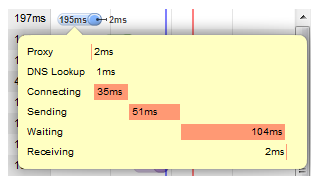
- All the timing information about your resource loads now comes from the network stack, not WebKit, so timing information now adequately represents raw network timing. You can see detailed timing for different phases of the loading by hovering over the log entry.
- We now push raw HTTP headers and status messages into Chrome Developer Tools. As a result, you now see precisely what the browser received from the server and not just how the rendering engine interpreted that information.
- Similarly to the old Resources panel, you can see syntax-highlighted resource contents.
We’ve also made CSS editing a whole lot easier. In particular, you’ll now find separate fields for property names and values instead of a single field for both. As you type, you will see suggestions of available keywords for property values.

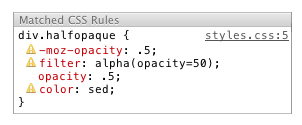
But that’s only the tip of the iceberg. Similar to the changes in the network panel, the CSS sidebar now shows the raw information that the browser gets from the server – not the rendering engine’s interpretation of the information. As a result, you can use Chrome Developer Tools to see CSS properties that are not recognized by WebKit (e.g., engine-specific or simply erroneous properties). This finally puts an end to the nightmare of disappearing invalid properties.

For a more complete reference on working with the Chrome Developer Tools, check out our new home page. The CSS improvements that we implemented upstream in WebKit are further described in our WebKit blog post. And for even more tips on how to use Chrome Developer Tools, watch the new video below.

