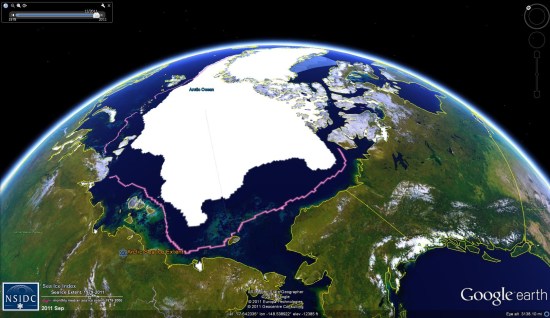
As they’ve done for the past few years (here is 2010), the National Snow and Ice Data Center (NSIDC) has produced their annual Sea Ice Extent data

While 2011 wasn’t a record year for ice loss, it came close, ending just slightly above the mark set in 2007. You can view the data for yourself by loading this KMZ file![]() .
.
Here are the details for this year:
Average ice extent for September 2011 was 4.61 million square kilometers (1.78 million square miles), 2.43 million square kilometers (938,000 square miles) below the 1979 to 2000 average. This was 310,000 square kilometers (120,000 square miles) above the average for September 2007, the lowest monthly extent in the satellite record. Ice extent was below the 1979 to 2000 average everywhere except in the East Greenland Sea, where conditions were near average.
As in recent years, northern shipping routes opened up this summer. The Northern Sea Route opened by mid August and still appeared to be open as of the end of September. The southern “Amundsen Route” of the Northwest Passage, through the straits of the Canadian Arctic Archipelago, opened for the fifth year in a row. Overall, sea ice in the wider and deeper northern route through Parry Channel reached a record low, according to Stephen Howell of Environment Canada, based on Canadian Ice Service analysis. Parry Channel had a narrow strip of ice that blocked a short section of the channel, but it did appear to open briefly in early September.