Symbols and Heatmaps in the Google Maps API

The Google Maps API provides a robust platform in which you can add geographical context to your data in a variety of ways. Data visualization is therefore one of the elements at the heart of the Maps API, and today we’re introducing two new techniques for visualizing your data in flexible and dynamic ways.

Symbols

At SXSW Interactive in 2011, I attended a session on geotemporal data visualization that made me keen to make it easier for Maps API developers to build visualizations similar to those discussed. For this reason I’m particularly excited to introduce a simple, yet powerful, new concept to the Maps API v3 that we call Symbols.

Unlike the image icons currently used for marking locations on a map, a Symbol is defined as a vector shape. The size, stroke width, color, and opacity of the shape, are all set by the Maps API application and can be dynamically modified. A small number of shapes, such as a circle, are provided by the Maps API, and custom shapes can be expressed as an SVG path.

Symbols open up a wide range of compelling new possibilities for data visualization and visual effects. For example, the below map illustrates the expansion of the Walmart chain of stores between 1962 and 2006:

In addition to using symbols to represent point features you can also decorate polylines with Symbols. One or more symbols, such as an arrowhead, can be placed at fixed positions on the polyline or repeated along the polyline. Because the polyline that has been decorated does not need to be visible, this feature can also be used to created dotted or dashed polylines, and just as the style of the symbols can be dynamically modified, so too can their location on the polyline:

Heatmaps

Developers often ask how they can represent large amounts of data on a map. Improvements in web browser technology have increased the number of markers that can be rendered by a Maps API application, but above a certain threshold the density of markers can overwhelm the user.

An alternative approach is to use a heatmap, and to enable this approach we’re launching support for browser rendering of heatmaps by the Maps API using the new Heatmap Layer. Your Maps API application can define the colour spectrum, intensity range, and behaviour of the heatmap when the map is zoomed. Here’s the Walmart example from above, but this time visualized as a heatmap:

If you have any technical questions about these new features, we recommend engaging with our developer community online, or joining our regular Google Maps API Office Hours. If you’re at I/O come see us in person at Office Hours in the Google Maps developer sandbox.
 

Two New Data Modules for Bing Maps V7


By Ricky Brundritt, EMEA Bing Maps Technology Solution Professional

In September of 2011 we started the Bing Maps v7 Module CodePlex Project. The purpose of this project is to create a centralized location where developers could find and share useful modules that expand the functionality of the Bing Maps V7 API. Since the start of the project, we’ve had 15 modules submitted.

Today, I would like to highlight the two newest modules added to the project and provide a few updates to existing modules.

GeoJSON Module

Download here

This module was created by Brian Norman a Microsoft Bing Maps MVP from Earthware Ltd.

This module allows you to import GeoJSON files into Bing Maps. A GeoJSON feed will be downloaded and parsed into an EntityCollection which can then be added to the map. Additional properties are captured and stored in a Metadata tag on each shape making it easy to relate shapes to their metadata.

GeoJSON is a data format standard used for representing geospatial objects in JSON (JavaScript Object notation). JSON is much more compact than XML which makes it a great format for sharing spatial data online. In fact the AJAX Map DataConnector uses GeoJSON to send spatial data from SQL Server to Bing Maps.

Well Known Text Reader/Writer Module

Download here

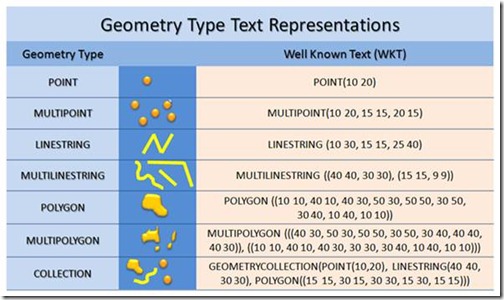
I created this module because I wanted a simple tool for quickly visualizing Well Known Text on Bing Maps. This module allows you to easily read and write Well Know Text data from Bing Maps. When reading Well Known Text data it is parsed into Bing Maps shapes; MultiPoint, MultiLinstring, MultiPolygon and GeometryCollection are turned into an EntityCollection of shapes. To write Well Known Text simply pass in a Bing Maps shape and the Well Known Text equivalent will be returned.

clip_image004

Well Known Text (WKT) is an OGC (Open Geospatial Consortium) standard for representing Geospatial Data. In fact WKT is supported by the spatial types in Microsoft SQL Server 2008 and above as well as SQL Azure.

*Project Idea: Combine this module with the Shape Toolbox Module and make it easy for your users to draw on the map and upload the shape data into Microsoft SQL Server.

*Demo Tip: Use this module to quickly create demos that render complex spatial data. Simply store your Well Known Text in a JavaScript file as a string to save time setting up a web service to connect to your database. Note: this approach is not recommended for production applications as loading all the spatial data via a JavaScript file can make for slow loading of your application.

Other Data Related Modules

GeoRSS Module – GeoRSS is a common XML file format for sharing spatial data as a syndication feed. This module also supports GML, an OGC compliant XML format. This module has been updated to support Complex Polygons (polygons with holes).

GPX Module – GPX is a common XML data format that is used by GPS devices. Many GPS devices allow you to stave points, routes and tracks which can then be exported from the device in GPX format. This module makes it easy to view these files on Bing Maps.

Spreadsheet Mapper now with more advanced customization

Do you have a spreadsheet of locations that you’d like to see on a map? Here on the Google Earth Outreach team we talk to many nonprofits who use Google Earth and Maps to tell their stories and visualize their data. Often the data is in spreadsheets, or other tabular formats. Converting these rows and columns into a map brings the spreadsheet to life by providing geographic context and a new way to visualize the information.

Spreadsheet Mapper is a tool that enables anyone to easily create a well-designed KML file to show off their data in Google Earth and Maps. Since Spreadsheet Mapper is a Google Docs template, you fill in your data using the familiar interface of a spreadsheet, and create a great KML without any coding. It gives you all the cloud-based benefits of Google Docs, including collaborative editing and the ability to publish directly to the web.

When we released Spreadsheet Mapper 2 a few years ago, it had a number of limitations, especially with regard to the number of placemarks it could create and the available balloon templates. In response to user feedback, and taking advantage of new features in Google spreadsheets and Google Apps Scripts, we have upgraded Spreadsheet Mapper with a variety of new and improved features:

  • More placemarks: Support for 1,000 placemarks and ability to add more as needed
  • Flexible balloon design: Take advantage of even more balloon design templates and simplified starter templates
  • Simplified publication: Just click “Publish to the web” to share your map (no more fussing with URLs)
  • New customization options: Advanced users can change the default view and network link details

Ready to try it? The Spreadsheet Mapper v3 tutorial will get you started.