Two New Data Modules for Bing Maps V7


By Ricky Brundritt, EMEA Bing Maps Technology Solution Professional

In September of 2011 we started the Bing Maps v7 Module CodePlex Project. The purpose of this project is to create a centralized location where developers could find and share useful modules that expand the functionality of the Bing Maps V7 API. Since the start of the project, we’ve had 15 modules submitted.

Today, I would like to highlight the two newest modules added to the project and provide a few updates to existing modules.

GeoJSON Module

Download here

This module was created by Brian Norman a Microsoft Bing Maps MVP from Earthware Ltd.

This module allows you to import GeoJSON files into Bing Maps. A GeoJSON feed will be downloaded and parsed into an EntityCollection which can then be added to the map. Additional properties are captured and stored in a Metadata tag on each shape making it easy to relate shapes to their metadata.

GeoJSON is a data format standard used for representing geospatial objects in JSON (JavaScript Object notation). JSON is much more compact than XML which makes it a great format for sharing spatial data online. In fact the AJAX Map DataConnector uses GeoJSON to send spatial data from SQL Server to Bing Maps.

Well Known Text Reader/Writer Module

Download here

I created this module because I wanted a simple tool for quickly visualizing Well Known Text on Bing Maps. This module allows you to easily read and write Well Know Text data from Bing Maps. When reading Well Known Text data it is parsed into Bing Maps shapes; MultiPoint, MultiLinstring, MultiPolygon and GeometryCollection are turned into an EntityCollection of shapes. To write Well Known Text simply pass in a Bing Maps shape and the Well Known Text equivalent will be returned.

clip_image004

Well Known Text (WKT) is an OGC (Open Geospatial Consortium) standard for representing Geospatial Data. In fact WKT is supported by the spatial types in Microsoft SQL Server 2008 and above as well as SQL Azure.

*Project Idea: Combine this module with the Shape Toolbox Module and make it easy for your users to draw on the map and upload the shape data into Microsoft SQL Server.

*Demo Tip: Use this module to quickly create demos that render complex spatial data. Simply store your Well Known Text in a JavaScript file as a string to save time setting up a web service to connect to your database. Note: this approach is not recommended for production applications as loading all the spatial data via a JavaScript file can make for slow loading of your application.

Other Data Related Modules

GeoRSS Module – GeoRSS is a common XML file format for sharing spatial data as a syndication feed. This module also supports GML, an OGC compliant XML format. This module has been updated to support Complex Polygons (polygons with holes).

GPX Module – GPX is a common XML data format that is used by GPS devices. Many GPS devices allow you to stave points, routes and tracks which can then be exported from the device in GPX format. This module makes it easy to view these files on Bing Maps.

The New Bing Maps Features


Coming back after the holiday season with a lot of energy, the Bing Maps team kicked off 2012 with releases of a new routing engine and the WPF control. Today–only 2 weeks later–we are now announcing several new features in the Bing Spatial Data Services and the Bing Maps Account Center. New features include a data source for traffic incidents, the ability to find points of interest (POI) along a route, wildcard-searches in your POI, incremental updates of POI data sources, improved reporting and more. Happy New Year! Are you feeling the love? Smile

The Bing Spatial Data Services provide a REST interface that allows you to geocode or reverse-geocode your own POI data sources in batch-mode, manage these data sources and query your own or some public POI data sources that Bing Maps provides in a spatial context.

Finding Traffic Incidents Along a Route using the new Spatial Data Services Query

In this release, we added the following features:

  1. Incremental Upload - Your own data sources now support incremental updates by setting the parameter ‘loadOperation’ in the Data Source Management API to ‘incremental’. So, once you’ve uploaded a data source of X number of locations into the Spatial Data Service, if you just want to add a few records you can just send those few records. We’ll handle the add and update functions for you!
  2. Wildcard Searches - New Query Options support wildcard searches through filter criteria. Let’s say you want to query your data source to find the nearest locations around a point AND you want to filter the results based on the beginning or end of a keyword. For example, let’s say you have a “Store Manager” field in your data source. You can look for said manager by last name, “%Smith” or first name “John%” so you get all the Smiths or Johns within a region.
  3. Traffic Incidents - Traffic Incidents for North America are now available as a public POI data source and can be accessed through the Query API. Now the traffic incidents you see on Bing Maps are available to you in your applications via a spatial query.
  4. Find Near Route - The Bing Spatial Data Service supports now an additional spatialFilter which allows you to search for POI along a route. This is a game changer. Let’s say you’re a coffee company and you want to empower your users to have the ability find all your locations along their drive from, say Seattle to San Francisco…now you can! The Find Near Route Feature allows you to spatially query the points you’ve uploaded into SDS within a 1 mile buffer of your route.

http:// spatial.virtualearth.net /REST/v1/data/
439698230d90496596083f3fe7aafeb2/
TrafficIncidents/
TrafficIncident
?key=[YOUR_BING_MAPS_KEY]
&$format=json
&jsonp=callbackFindTrafficIncidentsNearRoute
&spatialFilter=nearRoute(’47.678558349609375,-122.13098907470703′,
’47.60356140136719,-122.32943725585937′)

You will find a complete sample using the Bing Maps AJAX Control version 7 for visualization, the DirectionsManager class for driving directions, the TrafficLayer class for traffic-flow information and the Bing Spatial Data Services for traffic-incident information along a route here. Alternate versions of the SDK are available in PDF and .chm format, as well.

Note: Neither the Wildcard-search nor the spatial-filter ‘nearRoute’ are supported with the public data sources NAVTEQNA and NAVTEQEU.

The Bing Maps Account Center is the portal through which you can find information for development with Bing Maps, and also manage your account. It contains links to interactive and traditional SDKs, a facility to generate Bing Maps Keys, a web user interface to manage your own POI data sources and a reporting service through which you can retrieve statistics about your Bing Maps usage.

In this latest release we added the following features.

  1. Additional data validation has been introduced for the upload of your own POI data sources.
  2. Before it was already possible to add and edit records in a data source that you uploaded through the portal. You can now also download and delete data sources.M32small
  3. Image capturing adds now additional security during the generation of Bing Maps Keys.M33small
  4. Additional reports have been added to provide more details on the use of specific Bing Maps Keys.M34small

We certainly hope you’re feeling special (and spatial!). We’re investing quite a bit of energy into Bing Maps and hope to see some killer apps.

Now you can test your Mobile Web Apps with WebDriver

Mobile testing has come a long way since the days when testing mobile web applications was mostly manual and took days to complete. Selenium WebDriver is a browser automation tool that provides an elegant way of testing web applications. WebDriver makes it easy to write automated tests that ensure your site works correctly when viewed from an Android or iOS browser.

For those of you new to WebDriver, here are a few basics about how it helps you test your web application. WebDriver tests are end-to-end tests that exercise a web application just like a real user would. There is a comprehensive user guide on the Selenium site that covers the core APIs.

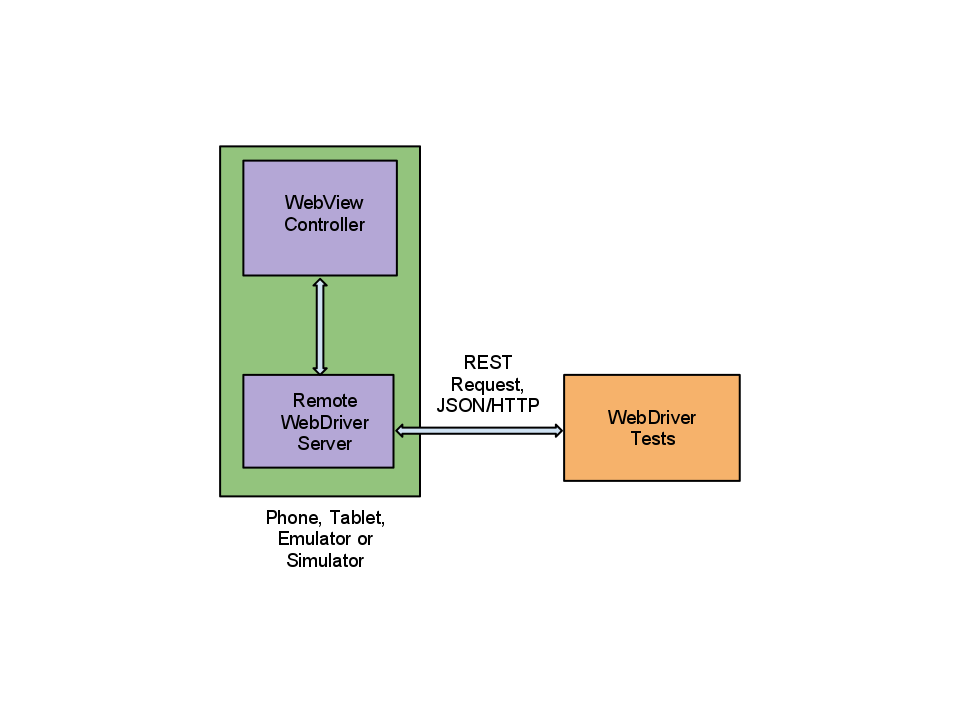
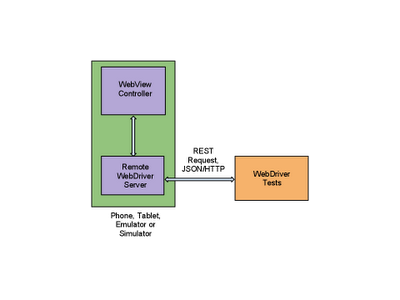
Now let’s talk about mobile! WebDriver provides a touch API that allows the test to interact with the web page through finger taps, flicks, finger scrolls, and long presses. It can rotate the display and provides a friendly API to interact with HTML5 features such as local storage, session storage and application cache. Mobile WebDrivers use the remote WebDriver server, following a client/server architecture. The client piece consists of the test code, while the server piece is the application that is installed on the device.

Get Started


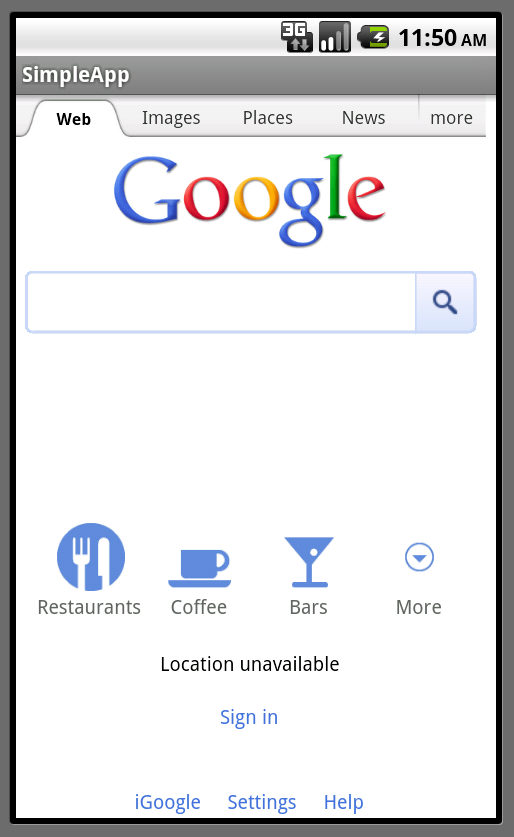
WebDriver for Android and iPhone can be installed following these instructions. Once you’ve done that, you will be ready to write tests. Let’s start with a basic example using www.google.com to give you a taste of what’s possible.

The test below opens www.google.com on Android and issues a query for “weather in san francisco”. The test will verify that Google returns search results and that the first result returned is giving the weather in San Francisco.

public void testGoogleCanGiveWeatherResults() {
// Create a WebDriver instance with the activity in which we want the test to run.
WebDriver driver = new AndroidDriver(getActivity());
// Let’s open a web page
driver.get(“http://www.google.com”);

// Lookup for the search box by its name
WebElement searchBox = driver.findElement(By.name(“q”));

// Enter a search query and submit
searchBox.sendKeys(“weather in san francisco”);
searchBox.submit();

// Making sure that Google shows 11 results
WebElement resultSection = driver.findElement(By.id(“ires”));
List searchResults = resultSection.findElements(By.tagName(“li”));
assertEquals(11, searchResults.size());

// Let’s ensure that the first result shown is the weather widget
WebElement weatherWidget = searchResults.get(0);
assertTrue(weatherWidget.getText().contains(“Weather for San Francisco, CA”));
}

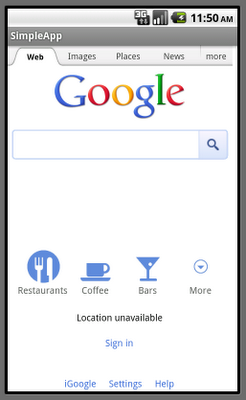
Now let’s see our test in action! When you launch your test through your favorite IDE or using the command line, WebDriver will bring up a WebView in the foreground allowing you to see your web application as the test code is executing. You will see www.google.com loading, and the search query being typed in the search box.


We mentioned above that the WebDriver supports creating advanced gestures to interact with the device. Let’s use WebDriver to throw an image across the screen by flicking horizontally, and ensure that the next image in the gallery is displayed.

WebElement toFlick = driver.findElement(By.id(“image”));
// 400 pixels left at normal speed
Action flick = getBuilder(driver).flick(toFlick, 0, -400, FlickAction.SPEED_NORMAL)
.build();
flick.perform();
WebElement secondImage = driver.findElement(“secondImage”);
assertTrue(secondImage.isDisplayed());

Next, let’s rotate the screen and ensure that the image displayed on screen is resized.


assertEquals(landscapeSize, secondImage.getSize())
((Rotatable) driver).rotate(ScreenOrientation.PORTRAIT);
assertEquals(portraitSize, secondImage.getSize());

Let’s take a look at the local storage on the device, and ensure that the web application has set some key/value pairs.


// Get a handle on the local storage object
LocalStorage local = ((WebStorage) driver).getLocalStorage();
// Ensure that the key “name” is mapped
assertEquals(“testUser”, local.getItem(“name”));

What if your test reveals a bug? You can easily take a screenshot for help in future debugging:


File tempFile = ((TakesScreenshot) driver).getScreenshotAs(OutputType.FILE);

High Level Architecture

WebDriver has two main components: the server and the tests themselves. The server is an application that runs on the phone, tablet, emulator, or simulator and listens for incoming requests. It runs the tests against a WebView (the rendering component of mobile Android and iOS) configured like the browsers. Your tests run on the client side, and can be written in any languages supported by WebDriver, including Java and Python. The WebDriver tests communicate with the server by sending RESTful JSON requests over HTTP. The tests and server pieces don’t have to be on the same physical machine, although they can be. For Android you can also run the tests using the Android test framework instead of the remote WebDriver server.

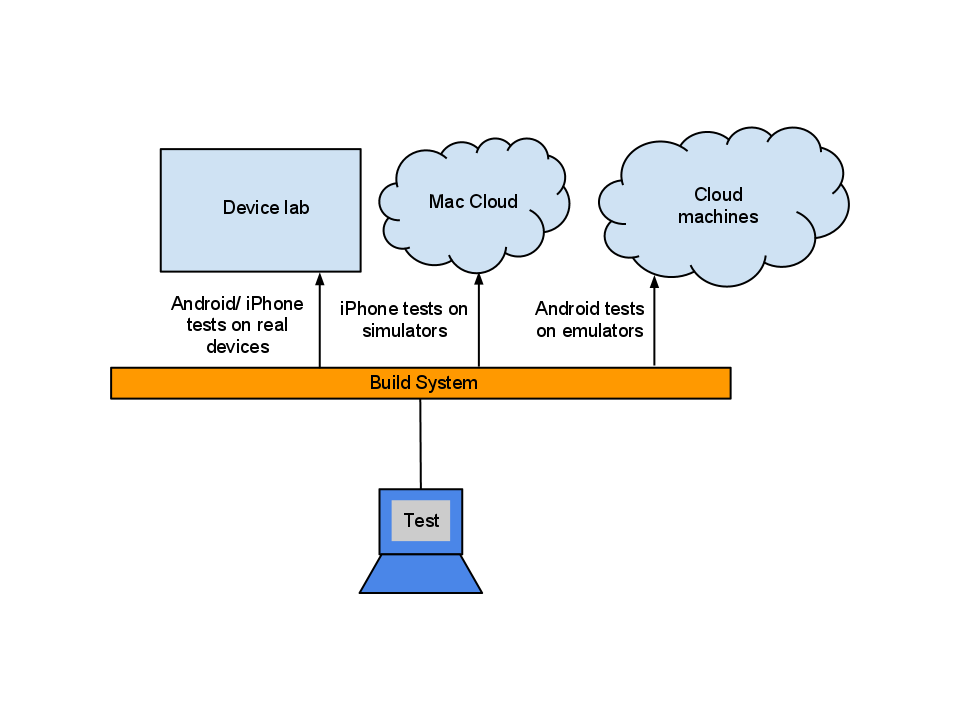
Infrastructure Setup

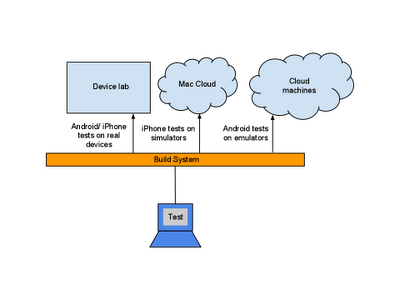
At Google, we have wired WebDriver tests to our cloud infrastructure allowing those tests to run at scale and making it possible to have them run in our continuous integration system. External developers can run their mobile tests either on emulators/simulators or real devices for Android and iOS phones and tablets.
Android emulators can run on most OSes because they are virtualized, so we run them on our generic cloud setup. Though there are many advantages to using Android emulators because they emulate a complete virtual device (including the virtual CPU, MMU, and hardware devices), it makes the test environment slower. You can speed up the tests by disabling animations, audio, skins, or even by running in the emulator headless mode. To do so, start the emulator with the options –no-boot-anim, –no-audio, –noskin, and –no-window. If you would like your tests to run even faster, start the emulator from a previously created snapshot image. That reduces the emulator startup time from 2 minutes to less than 2 seconds!
iOS simulators can’t be virtualized and hence need to run on Mac machines. However, because iOS simulators don’t try to emulate the virtual device or CPU at all, they can run as applications at “full speed,” this allows the test to run much faster.
Stay tuned for more mobile feature in Selenium WebDriver, and updates on the Selenium blog.

Google Maps Mashups 1

Climate Hot Map


The Union of Concerned Scientists has created this Google Map to show the probable effects of global warming around the world. The map is accompanied by a Climate Hot Map Scavenger Hunt, which if you complete successfully gives you a chance to win a trip for two to the Rio Cachoeira Natural Reserve in Brazil.

The map explores the effect of climate change on people, the environment, the oceans, ecosystems and the temperature. You can select to explore any of these categories on the map using the menu at the bottom of the map.

Planefinder.net


The ash cloud created by the eruption of the Puyehue volcano in Chile continues to cause huge disruption to plane flights in Australia. Real-time flight tracking website planefinder.net is using Google Maps to show the location of the ash cloud as it drifts around the southern hemisphere.

The ash cloud is predicted to linger over south-east Australia for some time, causing widespread disruption to flights in and out of Sydney and Melbourne. At the time of writing the planefinder.net map shows a few flights in and out of south-east Australian airports but nowhere near the flight activity that can be seen in and around Perth.

Mibazaar has created a Google Maps based application to explore where people are searching for a given keyword in Google Search.

In this demo of the application you can view where people are searching for different makes of Ford car around the world. For each make of car you can view the ten locations where the most people are searching for that Ford.

The map includes historical data so you can view how searches have changed over the years for each make of car.

Mibazaar – Google Trends – Ford

sailorsmap.com


SailorsMap is a Google Map designed to help boat owners find useful places nearby.

Marinas and local stores that may be useful are added to the map on the fly. If your browsing device supports GPS then SailorsMap is automatically positioned at your current location.

As well as displaying nearby points of information, found via Google Maps Search the map, displays the nautical anchorages of Croatia.

Censo2010


The Instituto Brasileiro de Geografia e Estatística has created an application that allows you to browse the results of the 2010 Brazilian census on a Google Map.

Using the application you can click on a census tract on the map and view demographic information collected in the census. The information includes the population, the percentage of men and women and the percentage of different age groups in the population.

Dotter Example – San Francisco Crime Map


This Google Map displays 5000 crimes in San Francisco almost instantly on a Google Map. The map was created with the Google Maps API and the Dotter.js, a javascript class that generates data URIs.

The crimes displayed were committed in San Francisco between the 25th April and 25th May 2011. What is really impressive about the map is how quickly the 5000 data points load on the map.

If you want to create your own super-fast map with thousands of data points then the Dotter.js class is available on Github

Quake-Catcher Network


Many laptops these days are built with accelerometers that are designed to protect your hard drive from damage. The accelerometer detects sudden movement and can switch the hard drive off so that the heads don’t crash on the platters.

The Quake-Catcher Network realised that they could create the world’s largest and densest earthquake monitoring system simply by using the data from accelerometers in the world’s laptop computers. The Quake-Catcher Network links participating laptops into a single coordinated network that can detect and analyze earthquakes faster and better than ever before.

QCN uses Google Maps to show the data collected from participating laptops and from participating desktop computers with USB sensors. The map also shows the latest USGS reported earthquakes.

Live Call Map – OnSIP


OnSIP, a provider of Voice over IP calls has released a real-time Google Map of calls made using its service.

The map makes nice use of the drop marker animation in the Google Maps v3 API. Each time an OnSIP customer makes or receives a call, a map marker is dropped on the live map, openly displaying call volume peak and trend information. A marker is dropped on the map every time an OnSIP customer makes or receives a call.

Map Channels


Map Channels, the popular Google Maps creation tool, now lets you add data to a map from Google Fusion Tables.

In the four years that Map Channels has been running over 20,000 maps have been created by its users. It has proved popular with casual map makers and with major news organisations., including Fox News and CBC.

You can create a Google Map with Map Channels using data from a KML, a Google Spreadsheet, a GeoRSS feed, tab delimited text and now with a Google Fusion Table. You can see an example of a Map Channels created map with data provided by a Fusion Table in this Wikipedia Events Map.

Postholer.com


Postholer.com has created a Google Map of some of America’s most interesting trails. The map includes the route of the Appalachian Trail, the Pacific Crest Rail, the Continental Divide Trail and many more.

When you select a trail its route is displayed on the map. You can then select to view waypoints, points of interest, parking, camping spots and photos along the trail from a drop-down menu.

As well as providing a Google Map of the trails Postholer.com also provides a full set of printable maps for each trail.

Ofcom – Broadband Speeds Map

Ofcom, the regulator of the UK communications industries, has created a Google Map to show the speed of broadband throughout the UK.

Each county in the UK has been ranked on how they score on four broadband metrics; average sync speed, percentage getting less than 2Mbit/s, superfast broadband availability and broadband take up. The map displays as a basic heat map with each county coloured to show how they perform overall on each metric.

The map confirms what you already probably suspected. If you want superfast broadband then you are more likely to be lucky if you live in a big city. If you live in the Outer Hebrides then you are probably going to have make do with superslow broadband.


Cross from Google Maps Mania