The World Wonders Project


There are a lot of amazing sites around the world, and thanks to Google’s various technologies such as Street View and Google Earth they’re easier to explore than ever. Google has now taken 132 historic sites from around the world and put them together into a single showcase called the World Wonders Project.


world-wonders.jpg 

The project covers major sites that we all know about, such as Stonehenge and Pompeii, and also covers lesser-known sites that are quite amazing, such as the Historic Villages of Shirakawa-go and Gokayama. This video shows a bit more about how it works:


The sites all include Street View imagery (much of which was captured using a Street View Trike), photos, videos, and 3D models in Google Earth.

Spreadsheet Mapper now with more advanced customization

Do you have a spreadsheet of locations that you’d like to see on a map? Here on the Google Earth Outreach team we talk to many nonprofits who use Google Earth and Maps to tell their stories and visualize their data. Often the data is in spreadsheets, or other tabular formats. Converting these rows and columns into a map brings the spreadsheet to life by providing geographic context and a new way to visualize the information.

Spreadsheet Mapper is a tool that enables anyone to easily create a well-designed KML file to show off their data in Google Earth and Maps. Since Spreadsheet Mapper is a Google Docs template, you fill in your data using the familiar interface of a spreadsheet, and create a great KML without any coding. It gives you all the cloud-based benefits of Google Docs, including collaborative editing and the ability to publish directly to the web.

When we released Spreadsheet Mapper 2 a few years ago, it had a number of limitations, especially with regard to the number of placemarks it could create and the available balloon templates. In response to user feedback, and taking advantage of new features in Google spreadsheets and Google Apps Scripts, we have upgraded Spreadsheet Mapper with a variety of new and improved features:

  • More placemarks: Support for 1,000 placemarks and ability to add more as needed
  • Flexible balloon design: Take advantage of even more balloon design templates and simplified starter templates
  • Simplified publication: Just click “Publish to the web” to share your map (no more fussing with URLs)
  • New customization options: Advanced users can change the default view and network link details

Ready to try it? The Spreadsheet Mapper v3 tutorial will get you started.

Protecting the world’s coral reefs through mapping

Editors Note: Today’s guest author is Katie Reytar, a Research Associate for the World Resources Institute. WRI was the recipient of a Google Earth Outreach Developer Grant, funded through the Google Inc. Charitable Giving Fund at the Tides Foundation. We’re excited to help them share and visualize the results of years of research about the state of the world’s reefs.

Since 1998, the World Resources Institute (WRI) has been using GIS (Geographic Information System) models to develop map-based assessments of threats to the world’s coral reefs. Reefs at Risk Revisited, released in February 2011, is the latest assessment in the series and is based on a nearly three-year study that produced the most highly-detailed global maps of coral reef threats to date. The study analyzed and mapped threats to coral reefs from local human activities such as coastal development, unsustainable fishing, and marine and land-based pollution, as well as climate-related threats caused by increasing levels of greenhouse gases in the atmosphere.

While the Reefs at Risk Revisited report, maps and data sets are the core components of our work, we found ourselves still searching for a compelling way to convey our findings on these dynamic yet fragile reef ecosystems. We also wanted to generate greater awareness of the unique characteristics of reef habitats across different geographies and the irreplaceable cultural and life-sustaining services that reefs provide to people all over the world. All of these elements are best communicated when you can see them for yourself, which is why we created a virtual tour of these reefs around the world with our Google Earth Outreach Developer Grant.


Watch a virtual tour of the most at-risk reefs in the world courtesy of the World Resources Institute.


In the tour, the Reefs at Risk Revisited maps come alive on Google Earth with photos and underwater video from each of the major coral reef regions of the world: the Caribbean, Middle East, Indian Ocean, Southeast Asia, Australia, and Pacific, as well as a global-level introduction and conclusion. The journey to each region provides a brief overview of the biodiversity of reef ecosystems, their importance to people and local economies, and the types and magnitudes of threats that reefs face, illustrated with footage of both healthy and damaged reefs.

You’ll also experience first hand these fantastically dynamic and productive ecosystems that extend across about 250,000 sq km (96,500 sq miles) of the tropical ocean. Even though this area represents less than 0.1% of the global ocean, reefs are home to as many as 25% of all known marine species. In the tropics, coral reefs are not only a critical habitat for marine species, but they also play an essential role in the lives of millions of people who live near them: they provide food and income from fisheries, revenue from tourism, and protection for coastal communities from storm surges.

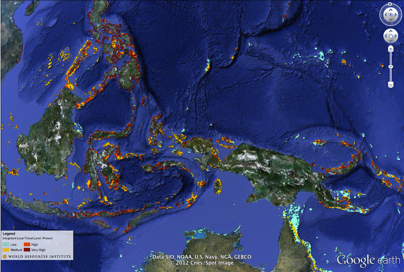
Among the other products of the Reefs at Risk Revisited project are global maps of coral reefs rated according to level of threat in the present, 2030, and 2050. These maps are available as downloadable KML files on the WRI website for viewing on Google Earth, and also as part of an online map developed using Google Fusion Tables. With these interactive maps you can zoom in to your favorite reef to explore it more closely in your own self-guided tour.

Explore Reefs at Risk Revisited in Google Earth.

We hope that you enjoy our tour and maps, and that you are able to visit a coral reef to learn more about these important and unique ecosystems. With improved understanding, we can manage and protect these resources so that we can all enjoy them and benefit from them for generations to come.

The pyKML – a Python library for manipulating KML

pyKML is an open source Python library for generating, parsing, and modifying KML, the geo-spatial data language used by Google Earth, Google Maps and a number of other GIS platforms.

I was motivated to create pyKML because I frequently need to visualize large, and often complex, environmental datasets. While the KML language has a wide range of options for styling, annotating and interacting with geo-spatial and temporal data, most programs that generate KML don’t take full advantage of these rich features. I created the pyKML library to address this problem by providing easy, programmatic access to all KML elements.

pyKML facilitates working with large and complex KML documents by leveraging the use of basic programming constructs (looping, branching, etc.). In this regard pyKML is similar to libkml, Google’s open source C++ library, but takes advantage of the highly readable syntax of the Python programming language and the processing capabilities of the popular lxml Python library.

As a simple example, check out this Python script that loops through a text string (“Hello World!”) and uses pyKML to create a series of KML Placemarks. You can download the resulting KML document, and below is a screenshot of how it looks in Google Earth.

This is just a teaser of what pyKML can do. For more complex examples, check out the pyKML documentation and the project’s Google Code site that includes sample code for: generating KML from CSV data, creating KML Tours, and visualizing ephermeris data for Stonehenge (e.g., orientation of the sun on different dates). pyKML can even be used to create “slides” for presentations!

To get started, browse the project’s documentation, install the library, try it out, and let us know what you think!

via:  Tyler Erickson, Senior Research Scientist / Engineer, MTRI

Google Earth: High-resolution imagery in Antarctica

As Google has continually improved the quality of their imagery across the globe, one area always seemed to stay low-res — Antarctica. Thanks to the help of the Polar Geospatial Center (PCG), that’s beginning to change.

A great example of that is the Mackay Glacier Tongue, located in Granite Harbor, seen here:

mackay.jpg

You can see it for yourself, as shown in the article, using this KML file.

So far, the PGC has helped Google update nearly 1,000,000 square kilometers, with another 275,000 square kilometers added every three months. While it will take a while to get the entire continent updated (more than 14,000,000 sq km), they’re certainly making great progress.

Along with updating the quality of the imagery, they’re also working to improve the accuracy of the location of the imagery. The PGC’s Paul Morin will be heading down to the Antarctic Peninsula soon to help improve the imagery from being off by as much as 30 meters to being accurate within a single meter.

The full article at The Antarctic Sun is quite interesting and well worth your time to read. We all enjoy the constantly improving imagery quality in Google Earth, and the PGC is just one of many companies working with Google to help move things forward.

(via @OgleEarth)