Twitter City Classification: The Mexican Bean Effect

Over the past few years one of the PhD students I supervise here in CASA has been working on the way cities ‘tick’. Fabian Neuhaus is examining the temporal aspects of global cities and the results are interesting.

One recent piece of work that caught our eye was Fabians classification sample of nine cities ordered from evening to morning based on twitter activity. Some cities seem to be more active in the morning and other in the evening. Dubai and Istanbul for example are clearly more active in the late hours, where on the other end Cairo and Bogota are early birds and tweet a lot more in the morning. The US cities Boston and Atlanta have both a peak in the morning and in the evening.

We liked the way Mexico’s twitter activity is bean shaped:


Image by urbanTick for NCL / timeRose diagram of 24 hours – showing twitter activity in percentage of total tweets by hour of the day. Covers the cities Cairo, Bogota, Mexico City, Manila, Atlanta ,Boston Los Angeles, Istanbul, Dubai.

Similarly there are preferences regarding the weekdays, not all areas tweet the same day. The early week days, Monday and Tuesday are generally less active than the rest of the week. Manila clearly prefers the weekend, where Cairo, Istanbul and Mexico City prefer the end of the week, Thursday and Friday. Dubai and especially Bogota have the least differences between the weekdays with very similar numbers of tweets through out the week.

Sneak Peak: QRCodes and iPads in The Grant Museum

Here at University College London, the Grant Museum of Zoology, which contains some of the rarest extinct animal specimens in the world, is to re-open on 15 March, 2011 after an eight-month renovation and moving period. Over the past few months we have been working here in CASA with the nice people over at the Centre for Digital Humanities and UCL Museums to build interactive signage for the exhibits.
Based around the ‘Tales of Things‘ technology, each artefact has a QRCode and Twitter Hash Tag allowing digital conversations to be carried out both inside and outside of the museum space. In typical ‘sneak peak’ photo mode, below is a look at one of the iPad mounts:

We are not sure why all first look photos are blurred, but such is the case. The project, known as ‘QRator’ is placing 10 iPads around the museum to explore new models for public engagement and informal learning in museums using handheld mobile devices and new interactive digital labels. The aim is to enable the public to collaborate and discuss museum concepts and object interpretation with museum curators, and academic researchers.
Wired UK has a good article on the Museum with a mention of QRCodes, for a more in depth view of such matters head over to Digital Nerdosaurus.
We will have much more on QRator over coming weeks….

Broadband Speed Mapped for BBC Look East Research

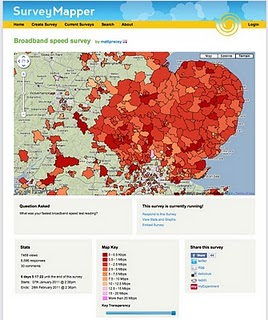
BBC Look East is calling for people in the East of England to find out their home broadband speed, as part of the TV programme’s week-long special – using our free SurveyMapper tool, at CASA, University College London, to collate and map the results in real time. So far over 6500 responses have been received.
It is estimated only 60% of households in the region have access to high speed broadband.
Look East’s business reporter Richard Bond said that the figure was unlikely to grow much in the next five years.
Home broadband users can take part by plotting their speed onto an interactive map.
The results of the research will then be shown on BBC One during Look East’s broadband week, which runs from 21 to 25 February 2011.
“Fibre optic networks, the key to a fast service, are only available to people in and around the major towns and cities,” said Mr Bond.
“Broadband speeds in rural areas are slow because they depend on copper telephone exchanges.
“Although BT is rolling out its fibre optic network, this is unlikely to make much of a difference to most rural communities over the next five years,” he added.

Speed test

Broadband users can test their upload speed on BBC News’ Technology website.
As broadband speeds on the same connection can fluctuate, it is recommended that people take the test several times and make a note of the highest speed.
Other speed-testing websites could return different results, so it is recommended for this research that third-party sites are avoided.
Once a figure is obtained, people can then plot their results on the BBC Look East map hosted on our SurveyMapper.
It is nice to see maps and indeed crowd sourced surveys used in such a way, SurveyMapper has been developed as part of NeISS (National e-Infrastructure for Social Simulation, funded by JISC as part of its Information Environment Programme.
You can set up your own survey or poll on SurveyMapper – If you have used other ‘polling sites’ then you will be up to speed, except we have taken away the restrictions and added real-time mapping into the mix. Simply sign up (its free) and then your be able to create your own survey and embed it into your own site. Currently we have five levels of survey available – Worldwide, based on countries, European Countries US Zip Code, UK Postcode and a Drag and Drop Pin Map.


You can ask anything, survey the nation, the world or just your street with real-time mapping and statistics.


To take part or create your own survey head over to SurveyMapper.com

The Look East survey runs until February 25th with updates each evening on BBC Look East News.