Tales of Things: Social Objects in the New York Times

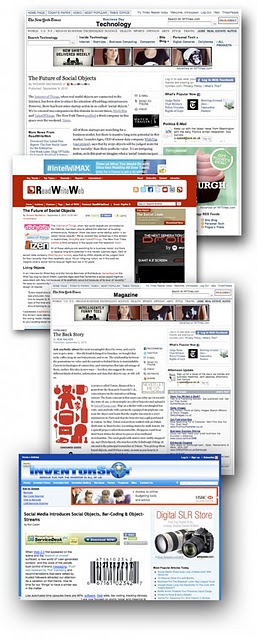
Its been a busy time, thus the slight reduction in posts – its all good though, we are launching a new survey system with the Mayor of London next week, a tweet-o-meter exhibit in the British Library and our other current project Tales of Things has reached the New York Times, twice…

Rob Walkers article is a good introduction to the potential of tagging and in particular memory. This article has launched many other blogs and tweets that tell our story along with Itizen and Stickbits. Try this: http://twitter.com/#search?q=social%20objects

and these links…

NYTimes1 , NYTimes2 , Read/Write/Web , Inventorspot

The Back Story

By Rob Walker

Ask anybody about the most meaningful object he owns, and you’re sure to get a story — this old trunk belonged to Grandpa, we bought that tacky coffee mug on our honeymoon, and so on. The relationship between the possessions we value and the narratives behind them is unmistakable. Current technologies of connection, and enterprises that take advantage of them, surface this idea in new ways — but they also suggest the many different kinds of stories, information and data that objects can, or will, tell us.

A project called Totem, financed by a grant from the Research Councils U.K., concentrates on the narratives of thing-owners. The basic concept is that users can write up (or record) the story of, say, a chess trophy or a silver bracelet and upload it to TalesofThings.com. Slap on a sticker with a newfangled bar code, and anybody with a properly equipped smartphone can scan the object and learn that the trophy was won in a 2007 tournament in Paris and that the bracelet was a gift purchased in Lisbon.

In May, Totem researchers worked with an Oxfam thrift store in Manchester, recording stories by stuff-donors, for a spinoff project called RememberMe. Shoppers could hear short back stories for about 60 pieces of secondhand merchandise. The used goods with stories were swiftly snapped up, says Chris Speed, who teaches at the Edinburgh College of Art and is the principal researcher at Totem: “You pick up these banal objects, and if it has a story, as soon as you hear it, it becomes something far richer.”

You can follow all updates via the TOTeM Blog
AGI report: State of GI in 5 years time.

This was a report predicting the future of GI in 2015. It’s a good summary made up of opinion from a broad spectrum of GI experts. Of particular interest to me was the section on cartography and visualisation (p 18 main report):

“However, it is not clear if cartographers or visual designers will have more influence in these [challenges of 3D visualisation] developments.”
is an intelligent point to make, I see far more visual designers playing with maps on the web than I do cartographers embracing the new GeoWeb tools so it will be interesting to see who influences the development of augmented reality applications the most. However the quote,
“The contrary view is that we may see the death of the conventional 2D map by 2015”
is just plain silly. History is littered with examples of new technologies that were predicted to kill older technologies and didn’t. Fax machines were killed by email but theatre, radio and ovens were not killed by cinema, TV and microwaves respectively. There is lots to be said for a 2D generalised map, augmented reality on phones may be dominant by 2015 but don’t expect the 2D map to become extinct.
Cartography and Visualization by Mackness is a separate report which the main report summarised. He brings up a good point about the importance of zoom:
improved capacity to model geographic spaces at multiple levels of detail. Data modelling at multiple scales to support ‘intelligent zoom’ – hugely facilitate map based tasks associated with small devices (with small screen real estate) ”
zoom is important and I think it even goes beyond his mobile devices – its very useful on PCs too.
But I was disappointed that whilst he thinks “maps as interface”, will be more important to the public in the future he doesn’t identify usability of maps as a possible impediment to the development of GI. With each new function developers get to wield in map making there is a slew of bad implementations that are a result of ignoring usability issues, IMHO this is definitely an impediment to effective use of GI tools.
GI and Climate Change: Moving onto the section in the main report I was pleased to see some understanding of the importance of usability being talked about:
“Increasing sophistication in the analysis, presentation and understanding of uncertainty issues, for example how to communicate probabilistic [sic] based information sets. This issue is particularly relevant for scenario forecasting such as climate change or flood risk analysis, where there are increasingly sophisticated datasets availability [sic]”
I agree communication of difficult to understand spatial data to the public will grow in importance. Much the same point is made in the section on renewable energy.
The Data Deluge: Finally, in this section the report talks about the cost of data going down which produces the problem of a data deluge for the public:
“This means that rather than being able to let “the figures talk for themselves” it becomes increasingly important how the information is presented and telling the story associated with the information in a compelling way. This does not mean however to filter the information, to protect it, or to otherwise impede its release – that would be counter productive. Rather the increasing availability of GIS tools and “geoweb” enthusiasts mean that there is a wider pool of people who can be partners in understanding and communicating the issues.”
Google Earth Tours are already an answer to ‘telling the story’ for the amateur enthusiast and I look forward to seeing them and other similar technologies become more popular as ways to dissect public data.