GreenspaceLive is a software and consultancy shop based on the Isle of Lewis in Scotland. The company was founded in 2008 as a spin-out from the Greenspace Research, a low-carbon building and renewable energy research program at Lews Castle College, University of the Highlands and Islands. This case study about gModeller, the company’s SketchUp energy analysis plugin based on gbXML, comes to us from Donald Macaskill, Technical Manager and Energy Engineer at GreenspaceLive.
Making hospitals more energy efficient
Hospitals have unique energy consumption demands. Not only do a hospitals require lighting and heating 24 hours a day, but they also require ventilation, sterilization, laundry, food preparation and important medical equipment to be powered as well. Therefore, any improvements made to the building could drastically reduce the bills, freeing up money to be spent elsewhere.
The NHS Western Isles Trust are very proactive in trying to reduce their energy costs and carbon footprint. To determine their baseline energy consumption and carbon emissions and then to simulate a number of fabric and technology improvements to their largest building, they turned to GreenspaceLive. A hospital model and energy analysis workflow was created in Google SketchUp Pro with GreenspaceLive’s gTools suite.
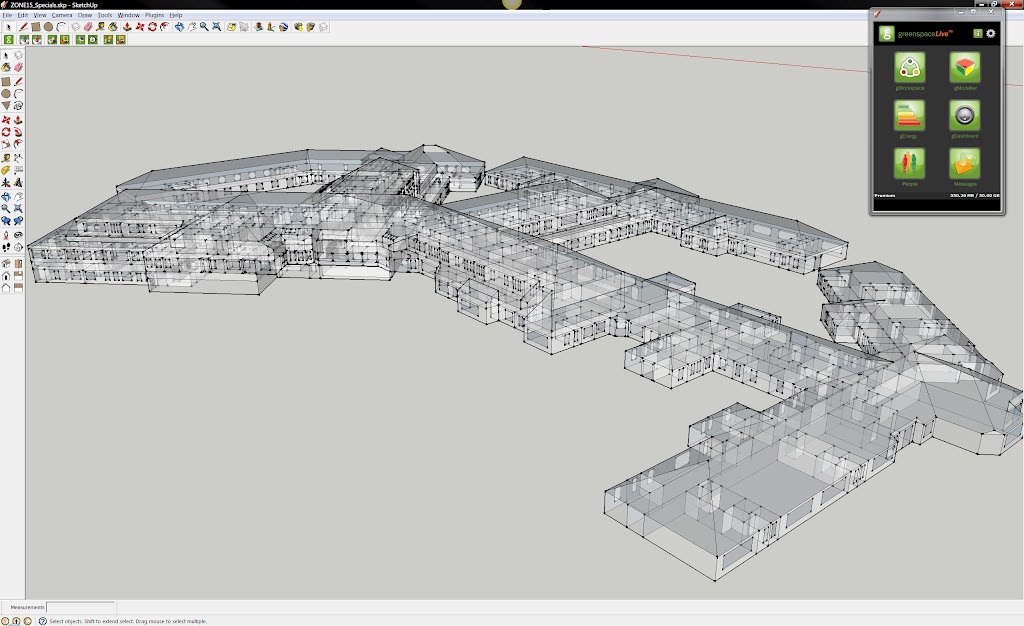
Completed model for gModeller
Project Methodology
To start, existing 2D CAD models and scanned paper drawings were shared via gWorkspace. These floor plans were then imported into Google SketchUp Pro. Once the floor plans had been imported, each floor was extruded to the correct height and dimensions. A detailed model is not required for the gModeller plugin, so the model could be simplified to single faces for walls, floors and roofs.
Once completed, attributes were added to the model using the gModeller’s customised materials, located within the Paint Bucket tool in SketchUp. Next, spaces were identified using the manual Space tool, which allowed the model to have zone specific information, such as heating, lighting and ventilation for different areas.
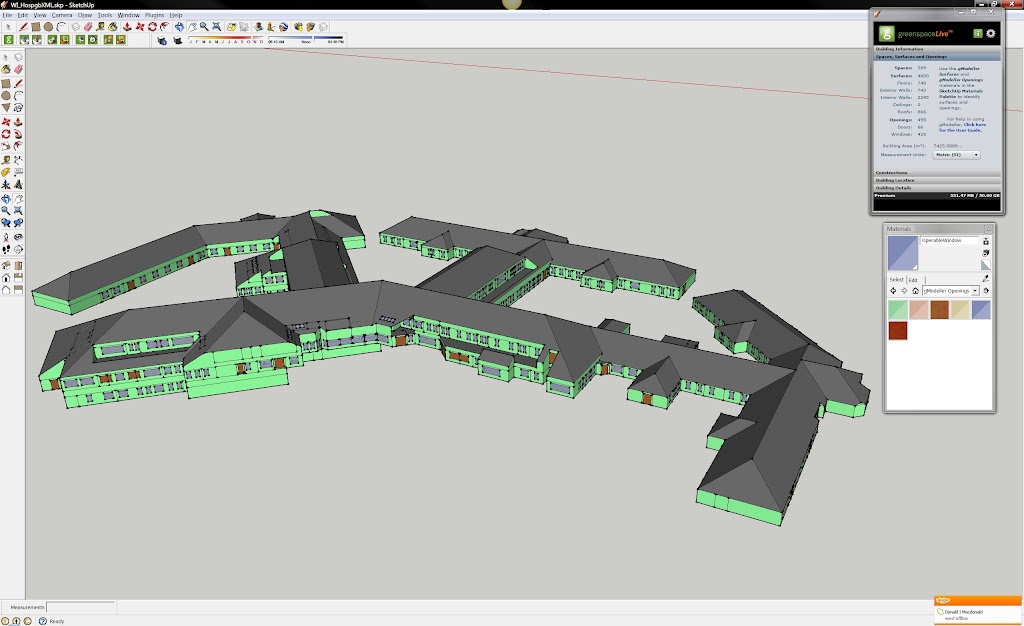
The completed gbXmL model
The gbXML building information model generated by gModeller was now ready to be exported to an energy analysis engine. In this case, gEnergy was used, however, exported models can also be imported into Green Building Studio, Ecotect, Trace, DesignBuilder and others. gEnergy was initially run using the Hospital’s existing fabric and technologies to establish a baseline Energy Performance rating, subsequent analysis runs were then carried out with simulated improvements to the building, including proposed refurbishment changes, to determine the impact they would have on performance of the building.
Once gEnergy runs were completed, the model was exported to Google Earth and presented to the clients, showing gDashboard energy results on screen while touring their model.
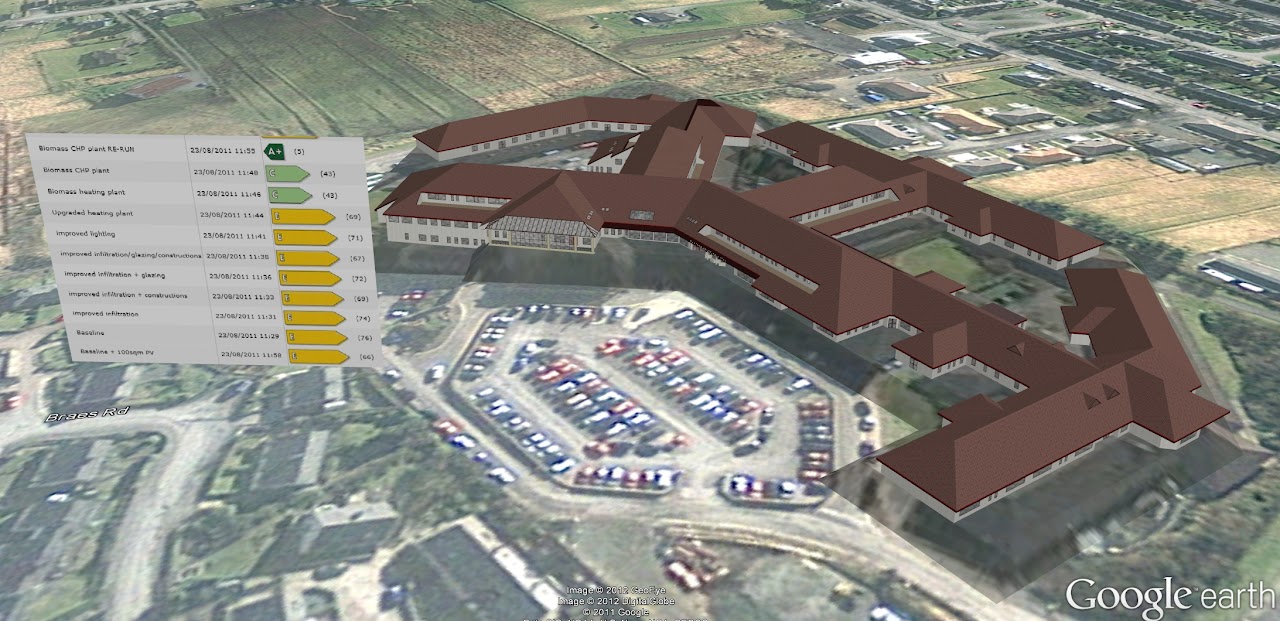
The model in Google Earth with energy data
Using the gWorkspace cloud platform, the modeling team was able to share and collaborate with the client throughout the process. Team members and client representatives were able to view, download and share files from the project, as well as view all energy runs that were undertaken.
The Results
Armed with the tools and the data, NHS Western Isles Hospital were able to model different scenarios and view the impact these changes would have. The results were dramatic – making a number of changes to the heating system, the team was able to demonstrate that the most effective change would result in over 50% energy savings, while reducing the CO2 emissions by almost 80%.
Dave Tierney, part of the Energy Team at NHS Western Isles Hospital said, “Using gTools, senior executives and staff received an overview of our carbon emissions, energy consumption and the impact changes in technology and fabric will have on our building. We can clearly see the differences in low carbon technology investment options. The results will help shape our plans for tackling carbon emissions and energy consumption in the future.”