The seafloor in Google Earth

More than two-thirds of Earth is covered by oceans. If you drained all of that water away, you’d see huge basins that have never been explored, an undiscovered planet in our own backyard.

Today is the three year anniversary of an explorable ocean seafloor in Google Earth. We just released a major update to our global underwater terrain dataset, called bathymetry, from the Scripps Institution of Oceanography, in partnership with NOAA, the US Navy, NGA, and GEBCO (with major contributions from IFREMER and IBCAO).

The update covers ocean topography from all over the globe and reveals our most accurate view of the seafloor to date. This new detail comes from spacecraft measurements of bumps and dips in the ocean surface as well as shipboard soundings from surveys carried out by over 40 countries. With this update to ocean terrain data in Google Earth, 15 percent of the seafloor is now available at 1 km resolution.

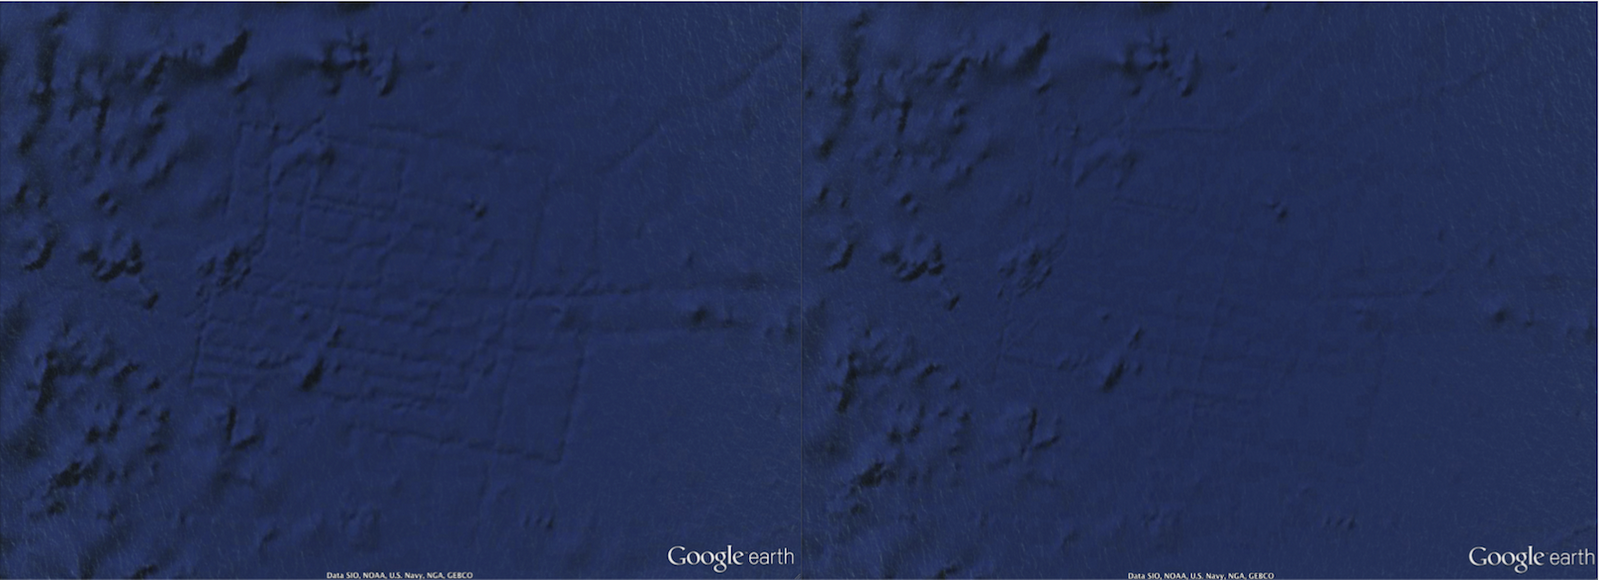
You may remember a Sun article reporting the discovery of a street grid where it’s believed the lost city of Atlantis would have been located off the West Coast of Africa. The discovery turned out to be a data artifact related to the way data was collected from a ship sailing back and forth to survey an unknown area. This recent seafloor update has been improved to blend better, and “Atlantis” has again disappeared into legend.

Previous terrain data showed what appeared to be a city grid on the ocean floor (left), which was confused for the lost city of Atlantis. Updated data more accurately reflects the seafloor terrain (right).

(Click on image to enlarge)


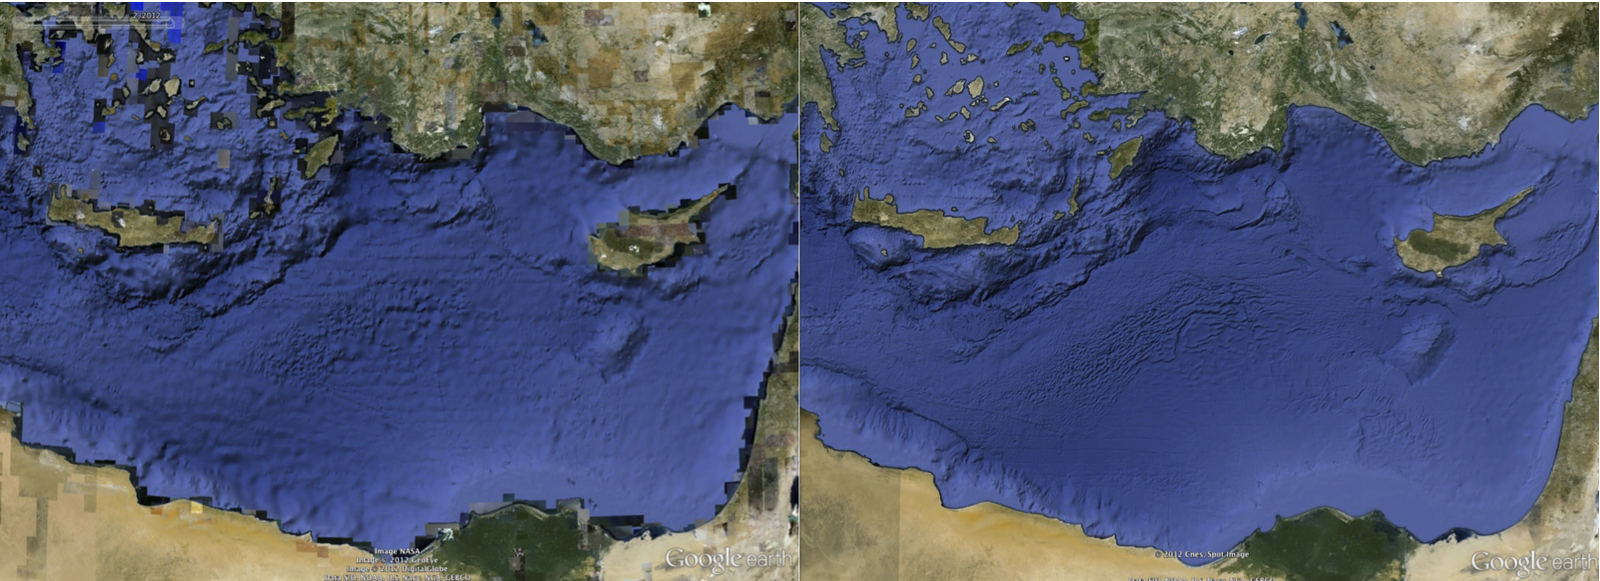
Another place you’ll notice an improvement in the ocean terrain data is the Mediterranean Sea, particularly south of Cyprus, where the boundary between the Eurasian and Arabian plates is now more clearly defined.

The Mediterranean Sea: before (left) and after (right)

(Click on image to enlarge)

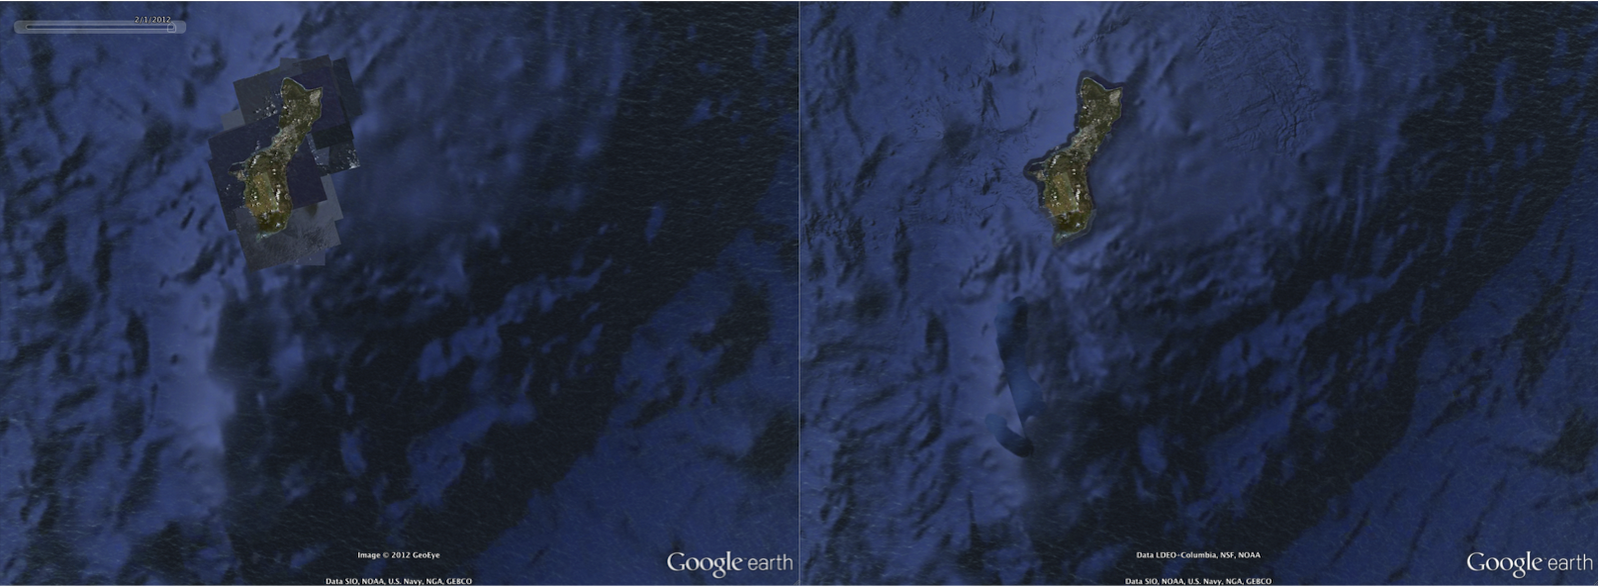
Our last example shows improvements to the land-sea mask along the coastline of Guam. You’ll notice a dramatic improvement in the resolution of both the coastline and neighboring Mariana’s Trench, the deepest trench in the world.

Guam and Mariana’s Trench before (left) and after (right)

(Click on image to enlarge)

In order to make this update possible, our partners at the Scripps Institution of Oceanography at UCSD have curated 30 years of data from more than 8,000 ship cruises and 135 different institutions. If you’d like to get a closer look at these changes, watch our video tour of this new terrain.

We hope you enjoy diving deeper than ever in Google Earth!

Pacific Crossing in Google Earth

Join a journey of discovery virtually in Google Earth, as Liquid Robotics launches four wave-powered robotic gliders to cross the Pacific ocean in their Pacific Crossing (PacX) Challenge Expedition. The wave gliders are attempting to set a new world record for the longest distance ever attempted by an unmanned vehicle and will be collecting data about the Pacific ocean for use by scientists and students back on dry land. These R2D2s of the sea will cross 25,000 miles over 300 days and collect over 2 million data points, helping build the record of oceanic knowledge.

Wave glider robots await launch from San Francisco in this first expedition blog post in Google Earth.
To follow the wave gliders in Google Earth, download the expedition KML file or open the PacX Gallery page and click on the ship icon. You will be able to read updates from scientists sharing the latest robotic observations, from wave height in storms to weather measurements like barometric pressure, wind speed and air temperature. The ship icon will represent the location of the wave gliders, starting in the San Francisco bay.

The earthquake tsunami changed the Ice


When the earthquake (and subsequent tsunami) struck Japan earlier this year, we provided as much data as possible about the disaster. What many people didn’t realize was that the tsunami continued to travel across the ocean, eventually striking Antarctica with a great deal of force. This caused some flexing and breaking of the Sulzberger Ice Shelf, which resulted in two large icebergs being released, reminicient of the chunk of the Wilkins Ice Shelf that broke off a few years ago. Combined, the icebergs cover an area of 125 square kilometers, or more than twice the size of New York’s Manhattan Island!


sulzberger_sar_2011075.jpg 


You can download the KMZ file here.

If you turn on the “Borders and Labels” layer in Google Earth, you’ll see the yellow outlines match up quite well with the dark patches in the overlay, as seen here:


overlay.jpg