Bing Maps – Data Connector is an Open Source + Open Data project focused on connecting the power of Bing Maps Silverlight Control to the spatial query capabilities of SQL Server 2008.

Bing Maps Data Connector SQL Spatial
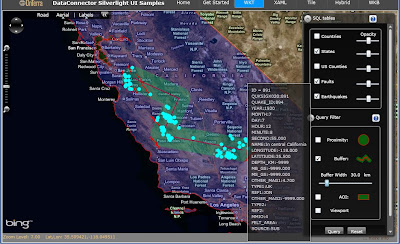
The Live Example – Finding Earthquakes using a user defined Buffer.
Solid Red line is Line to be buffered, green is the buffer, cyan is individual earthquake and associated attribution (date, size, duration).
The three basic parts of this project are the DataBase (SampleGeographyData), the WCF Services (DataConnectorWCF), and the Silverlight Client (DataConnectorUI2). The DataConnectorWCF and DataConnectorUI were developed using Visual Studio 2008 and the data base requires SQL Server 2008.

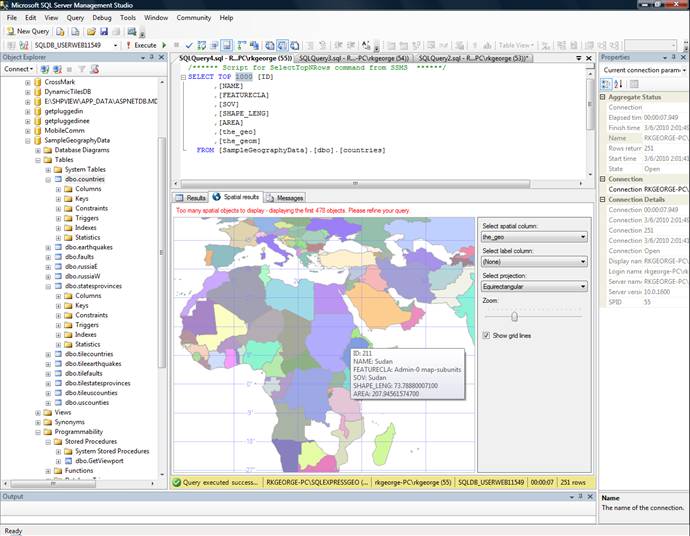
Bing Maps – Data Connector – SQL Server 2008 Query
These datasets imported to SQL 2008 were chosen to provide useful common data resources as well as examples of each type of spatial feature: points, lines, and polygons.
Additional data resources are easily added to SQL Server. The import utility used for this project was FME Translator from Safe Software.
http://www.safe.com
The data was imported as spatial type geometry and then corrected as required to make valid before updating to an additional geography spatial column. EPSG:4326 is the SRID used for all tables and constraints were added to enforce this srid. The end result is two spatial columns, “the geo” as geography, and “the geom” as geometry. Once imported the data was modified to include an “ID” column suitable for use as a primary key necessary for spatial indexing. For the sake of uniformity each table was also modified as necessary to provide a ‘NAME’ column. For the thematic polygon example an ‘AREA’ column was added to each of the polygon tables. Finally, spatial indices were added to the geography and the geometry columns.
There are lots of examples and blogs that explore Silverlight Mapping as well as resources for SQL Server Spatial. However, the WCF middle tier is not as well represented, which is the reason for publishing this project. The DataConnectorUI2 example Silverlight UI is a Navigation Project with examples of connecting to each of the sample WCF Services.
1. WKT example uses ‘Well Known Text’ to transmit SQL query results to the client.
2. XAML example transforms SQL query results into XAML, and then transmits as a XAML MapLayer.
3. Tile example builds raster png images in 256px x 256px tiles from the SQL query results. Tile Service feeds these to the client as MapTileLayer.TileSources endpoints. Tile has examples of both cached tiles and dynamic tiles. The thematic option will build dynamic tiles, otherwise tiles are cached in SQL Server as acquired.
4. Hybrid example combines tiles and XAML. Lower zoom levels use tile service for better performance with large data sets while higher zoom levels switch to XAML service to take advantage of vector interactivity.
Live Example : http://silverlight.onterrasys.com/dataconnectorUI/#/WKT


