2012 Model Your Town Competition

Over the past several months, hundreds of teams from all over the world have submitted stunning geo-models for our Google Model Your Town Competition. These examples of pure 3D civic pride are breathtaking to behold. Difficult as it was, the SketchUp team managed to pick six finalists, after which we asked the general public to vote for their favorite collection of models. Tens of thousands of you weighed in, and the talented team from the north of Spain were victorious. Zorionak! (That’s “Congratulations!” in Basque.)

The winning team is a dynamic duo: Josetxo Perez Fernandez, 36, is a professional who works in computer administration; and Pedro Domecq Aguirre, 45, is a programmer, 3D data specialist and network administrator. Those are their day jobs, anyway. It turns out that they’re actually world-class, polygon-wrangling, texture-mapping, megabyte-optimizing, geo-modeling superheroes. And now they’re bona fide local heroes, too. Thanks to them, millions of people across the globe can now get familiar with the beautiful little town of Getaria.


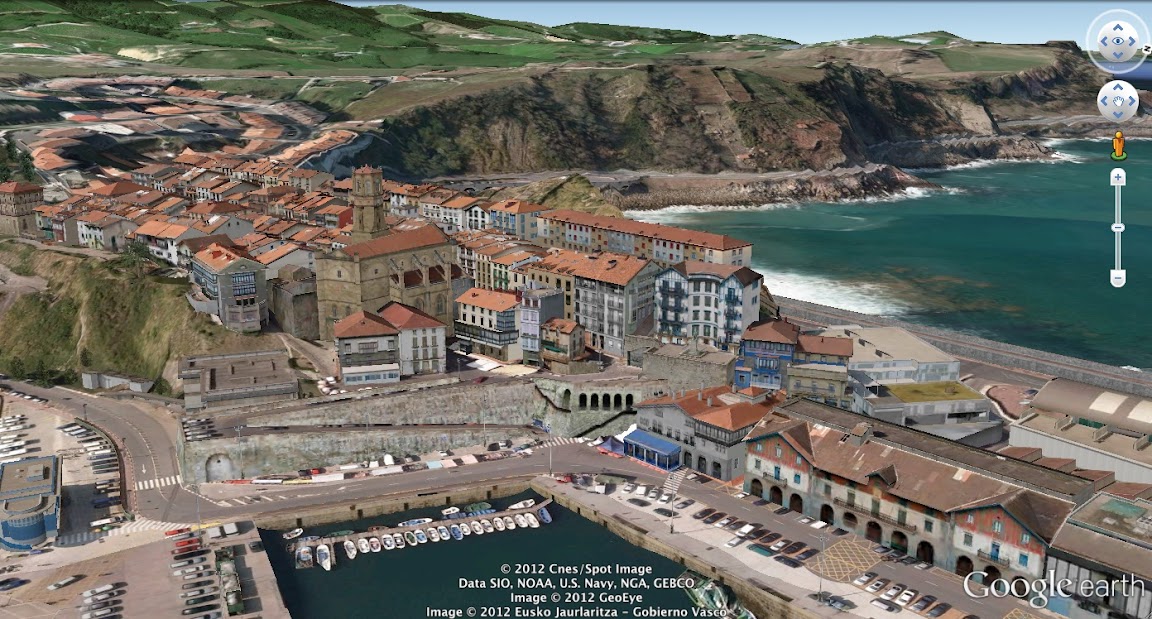
The beautiful coastline of Getaria

Not only that, but we’ll also be awarding US$25,000 to a local school and hosting a celebration with the town of Geteria in honor of Pedro’s and Josetxo’s accomplishment.


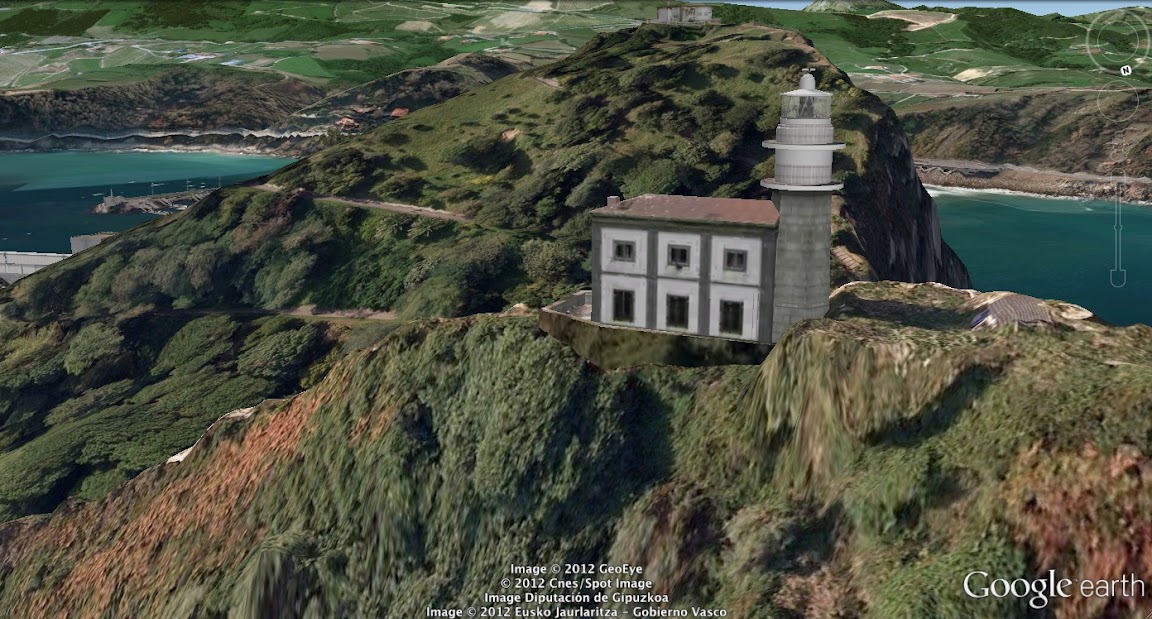
Getaria Lighthouse on Mount San Antón

Zorionak to the winning town, to the other five finalists, and to all the other entrants who collectively modeled almost 25,000 local landmarks that are now available for all to enjoy in Google Earth’s 3D Buildings layer. The virtual world is a richer place thanks to your efforts, and the real one is a lot better off, too.

The New Google Earth Imagery – February

Google has just pushed out a fresh batch of new imagery to a variety of places around the world.

dubai.jpg

Due to the new “Pretty Earth” imagery, it’s more difficult to spot fresh imagery. Also, the imagery this month arrived in Google Maps before Google Earth, which threw us off a bit. In any case, here are some of the locations that GEB readers have identified as having fresh imagery. Many of them were made aware of the new imagery via the Follow Your World notifications, which we certainly encourage you to sign up for.

Here is the list of updated areas we know about so far:

  • Canada: Villeneuve
  • Italy: Vernazza
  • Romania: Deva
  • Spain: Villacariedo
  • United Arab Emirates: Dubai
  • United States: California (Chino, Eureka), Illinois (Decatur), Louisiana (Alexandria), North Dakota (Minot), Tennessee (Johnson City, Kingsport)

DiscoverBPS

Every year in Boston, parents navigate the school selection process in an effort to get their kids into the best possible public schools. The process is complicated, and, depending on the outcome, can leave parents feeling frustrated and confused. DiscoverBPS was designed to make the process more intuitive, and to help parents make better choices for their kids.

Iteration #1 – Geocoded Addresses

In our first iteration, we used a home address and grade level to identify a student’s eligible schools, and then displayed the results on a map. In the screenshot below, the green circle represents the student’s “walk zone” (in this case, a 1.5 mile radius appropriate to a 7th grade student), the yellow polygon represents the North Assignment Zone, and the markers represent the schools.

With a little help from Google’s Geocoding and Maps APIs, we seemed to be well on our way!

On closer inspection, however, we noticed one school that fell just outside of the walk zone boundary, even though – after zooming in and switching to satellite view – the school campus was clearly overlapping with the walk zone:

Obviously, if our goal was to build a tool to make the process more intuitive, we needed to avoid introducing new ambiguities into the system.

Iteration #2 – School Parcel Shapefiles

To solve the overlap issue, we obtained shapefiles for all of the City’s school properties, and used a PostGIS-enabled database to calculate distances between the home address and the nearest point on the school parcel. In so doing, we were able to calculate walk zone distances, which allowed us to properly identify schools with walk zone eligibility:

After a several weeks of deep-diving into the internals of PostGIS mapping, we seemed to be back on track.

Stepping back, however, a new consideration came to light: was it fair to assume that a 7th grader could walk from downtown Boston, across the Charles River, and to a school in Charlestown in less than 1.5 miles? A Google Directions search suggested otherwise (the route below is estimated at 1.9 miles):

If the purpose of the walk zone policy was to determine which schools a student could reasonably get to on foot (and to discourage parents from busing their kids to schools on the other side of town), our walk zone circle began to seem misleading.

Iteration #3 – Walkshed Mapping

In the end, we decided to use an open source project called pgRouting (which extends PostGIS to provide geospatial routing functionality) along with OpenStreetMap to derive a “walkshed” polygon and to calculate street walking distances. We also could have used the Google Maps Distance Matrix API to calculate walking distance, but opted to go with pgRouting based on the need to create the walkshed polygon. These tools allowed us to then visualize the walkshed in Google Maps:

Aside from being noticeably smaller than the walk zone circle, the walkshed conveys a representation of walkability that is customized to the home address. Notice how the walkshed area is confined by bodies of water that are not spanned by any bridges.

DiscoverBPS is now live at www.discoverbps.org. The walkshed map (which would require policy changes by Boston Public Schools) is being considered for use in 2013.