This month’s MSDN magazine has an article describing how to create curved lines on the Bing Maps AJAX control. While I don’t want to criticise the author at all, there are two comments I would make on the article:
- Firstly, it’s written using v6.3 of the AJAX control – v7.0 has been available for well over 6 months now and (despite some teething problems) this latest version is recommended for all new development.
- Secondly, the article describes how to draw arbitrary Bezier curves on the projected plane of the map. Whilst this is an interesting exercise (and the author goes on to describe important concepts such as how to test the routine), it’s not actually that useful. More often, when we see curved lines on a map, we expect them to represent geodesics – the shortest path between two points on the surface of the earth. Although this was never the intention of the article, Bing Maps evangelist Chris Pendleton mistakenly drew this conclusion and tweeted a link to the article stating that it demonstrated geodesics, when in fact it does not.
Therefore, I thought that responding to this article would provide a good prompt for me to dust off and update my own v6.x geodesic curve script from several years ago (originally published here).
What’s a Geodesic, anyway?
A geodesic is a “locally-length minimising curve” (Mathworld) – it’s the shortest path between any two points on a given surface. On a flat plane, like a piece of paper, a geodesic is a straight line. On a sphere, a geodesic is a great circle. When dealing with geospatial data, a geodesic is the shortest distance between two points on the surface of the earth.
Generally speaking, Bing Maps has no regard for geodesic shapes relative to the earth’s surface – instead it draws shapes directly onto the projected map image. Drawing a straight line between two points on a map represents the shortest path between those points in the projected plane of the map, but it generally does not represent the shortest path between those same two points on the surface of the earth.
For example, consider a polyline drawn between Munich and Seattle, both of which lie at a latitude of approximately 48 degrees. You can define a polyline connecting these two points as follows:
Microsoft.Maps.Polyline([
  new Microsoft.Maps.Location(48, 11.5),
  new Microsoft.Maps.Location(48, -122)]);
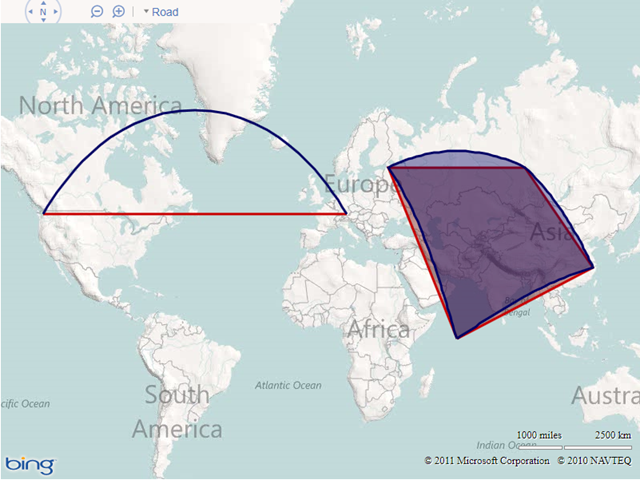
When displayed on the map, this polyline will follow a constant latitude between the two points, like this: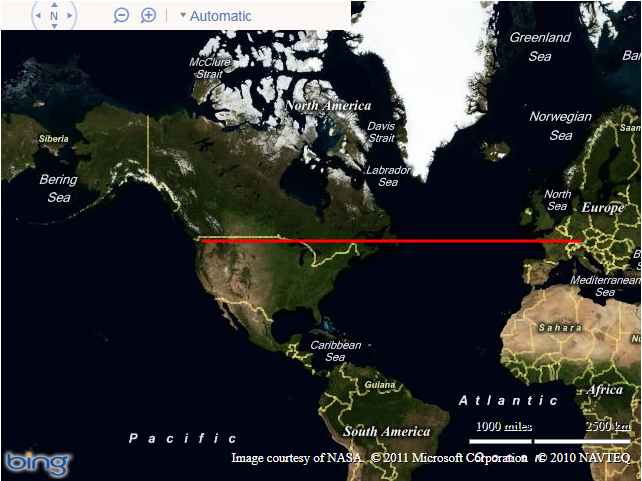
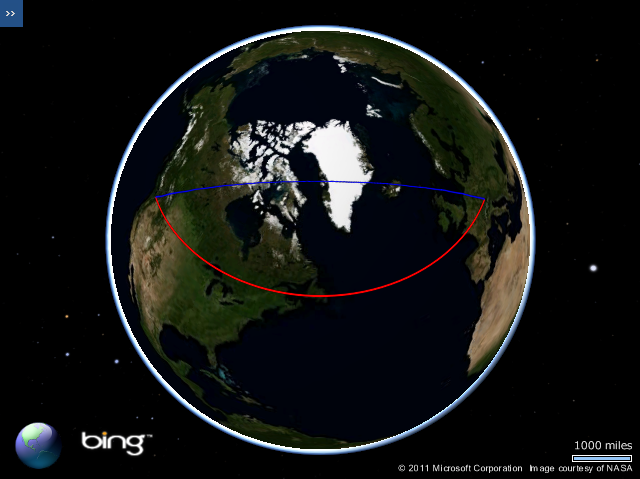
However, this is certainly not the shortest route between Munich and Seattle. If you are unsure why, consider how this same line would appear when viewed on a 3-dimensional model of the earth. In the screenshot below, the line that follows a constant latitude of 48 degrees, as shown above, is plotted in red, while the geodesic line that represents the true shortest line connecting the destinations is shown in blue:
Notice how, rather than being parallel to the equator, the geodesic route goes much further north over the top of the UK, then over Iceland, Greenland, and much of Canada before turning south again into Seattle. You can try this yourself on a globe – the geodesic route is the path that a piece of string follows when held tight between two locations. (For those readers familiar with SQL Server, the red line above is equivalent to a route calculated using the geometry datatype, while the blue line is equivalent to using the geography datatype)
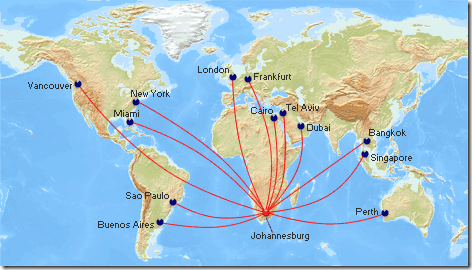
As shown above, the shortest “straight line” route on a map is not the shortest direct path between two points on a globe. Likewise, the shortest geodesic route between two locations on the globe does not generally correspond to a straight line on a map. This is why, when airline companies show maps illustrating the flightpaths to various destinations, the lines appear curved – because they’re representing the geodesic path on the surface of the earth, which, when projected onto a map, will generally not be straight lines:
Drawing Geodesic curves in Bing Maps
Geodesics are clearly very useful if you want to visualise the path of shortest distance between two points. So how do you go about drawing geodesic curves in Bing Maps? Well, Bing Maps does not support curved geometries directly, so instead we must approximate the shape of a geodesic curve by creating a polyline containing several small segments. Using a larger number of segments will make the polyline appear more smooth and more closely resemble the shape of the smooth curve, but will also increase its complexity. I find that using 32 segments is more than sufficient accuracy for most maps. We’ll call this value n.
var n = 32;
Then, we need to determine the overall extent of the route, which we’ll call d. The shortest distance between any two points on a sphere is the great circle distance. Assuming that the coordinates of the start and end points are (lat1, lon1) and (lat2, lon2) respectively, measured in Radians, then we can work out the great circle distance between them using the Haversine formula, as follows:
var d = 2 * asin(sqrt(pow((sin((lat1 - lat2) / 2)), 2) + cos(lat1) * cos(lat2) * pow((sin((lon1 - lon2) / 2)), 2)));
We then determine the coordinates of the endpoints of each segment along the geodesic path. If f is a value from 0 to 1, which represents the percentage of the route travelled from the start point (lat1,lon1) to the end point (lat2,lon2), then the latitude and longitude coordinates of the point that lies at f proportion of the route can be calculated as follows:
var A = sin((1 - f) * d) / sin(d);
var B = sin(f * d) / sin(d);

// Calculate 3D Cartesian coordinates of the point
var x = A * cos(lat1) * cos(lon1) + B * cos(lat2) * cos(lon2);
var y = A * cos(lat1) * sin(lon1) + B * cos(lat2) * sin(lon2);
var z = A * sin(lat1) + B * sin(lat2);

// Convert these to latitude/longitude
var lat = atan2(z, sqrt(pow(x, 2) + pow(y, 2)));
var lon = atan2(y, x);
By repeating the above with different values of f, (the number of repetitions set according to the number of segments in the line), we can construct an array of latitude and longitude coordinates at set intervals along the geodesic curve from which a polyline can be constructed.
The following code listing wraps this all together in a reusable function, ToGeodesic, that returns an array of points that approximate the geodesic path between the supplied polyline or polygon locations.
To demonstrate the use of the function, I’ve added two entity collections to the map. The simple layer acts a regular shape layer, containing polylines and polygons displayed in red. Whenever an entity is added to this collection, the entityAdded event handler fires, which converts the added entity into the equivalent geodesic shape and adds it to the geodesicShapeLayer, displayed in blue. By maintaining two layers you can continue to deal with shapes as per normal in the layer collection – the additional points needed to simulate the geodesic display of each shape only get added in the copy of the shape added to the geodesicShapeLayer. You may then, for example, choose not to display the non-geodesic layer and only use it as a method to manage shapes, while the geodesic layer is used to actually display them on the map.
Here’s the results, showing both the flat (red) and geodesic (blue) layers of a polyline and a polygon:
