Let’s discuss a little about the precision with which SQL Server stores coordinates in the geometry and geography datatype. To summarise:
- Well-Known Text, the format from which spatial data is most commonly created in SQL Server, is a text string in which coordinates are stated as decimal values.
- However, when you pass a WKT representation to a static method, such as STGeomFromText(), the resulting geometry or geography instance serializes each coordinate into an 8-byte binary value. In essence, each coordinate is CAST from nvarchar to binary(8).
- When you retrieve the WKT of a geometry or geography instance, using STAsText() or ToString(), the stored binary coordinate value is implicitly CAST back to a decimal text string again.
Just as when converting any other data between datatypes, there is therefore the potential for truncation or rounding errors introduced when you store and retrieve spatial data in SQL Server. In practice, the significance of these errors when you’re just storing and retrieving values is pretty small – an 8-byte binary value is capable of representing most decimal values with a precision equivalent to around 15 decimal places. If your coordinates are stated with less precision than this, you can fairly confident that SQL Server will store and retrieve them with full precision.
In this post I’m going to investigate a related, but perhaps more important topic, which is the precision with which SQL Server performs calculations on geometry and geography data. This is something you are likely to notice in any spatial application, however precise your original supplied coordinates are, and explains why sometimes you may get “incorrect” answers – LineStrings apparently self-intersecting when they shouldn’t, Points that lie outside of Polygons when they don’t, etc.
Before I go any further, I should perhaps issue a disclaimer:
- Spatial calculations involve some pretty complex maths (which, in SQL Server, are provided courtesy of Michael Kallay). I am not a mathematician (although my mum is).
- AFAIK, there is no public documentation on exactly how SQL Server performs spatial calculations. The content of this post is therefore based solely on scraps of information, background reading, and my own empirical research.
It is quite likely that sections of this post (if not this post in its entirety) are either slightly or wholly factually incorrect. Basically, I wouldn’t rely on it. However, I also know that “Spatial” Ed Katibah has frequented this blog in the past and, if I’m lucky, he might read it and add some comments to correct me where I’ve got it wrong…
Demonstrating The Problem
Surely, the whole point of using SQL Server’s methods rather than creating your own spatial library is that you shouldn’t have to worry about the maths behind how STIntersects() works – you just use it and you get the right result, right?
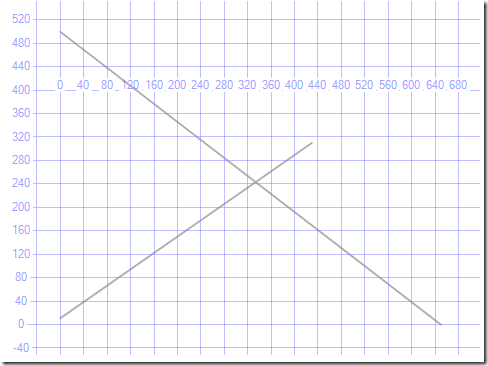
Well, not always… let’s look at example. Consider the following two lines:
[php]DECLARE @line1 geometry = ‘LINESTRING(0 11, 430 310)’;
DECLARE @line2 geometry = ‘LINESTRING(0 500, 650 0)’;[/php]
You can view them in SSMS Spatial Results tab as follows:
[php]SELECT @line1
UNION ALL SELECT @line2;[/php]
The two lines clearly cross each other, and SQL Server will tell us the point at which they cross using the STIntersection() method:
[php]SELECT
@line1.STIntersection(@line2).ToString()[/php]
The result is POINT (333.88420666910952 243.16599486991572)
So far, nothing unusual, but what about if we run this query instead:
SELECT
@line1.STIntersection(@line2).STIntersects(@line1),   --0
@line1.STIntersection(@line2).STIntersects(@line2)   --0
The STIntersects() method returns 0 in both cases. When expressed in words, the result of this query suggests “The point at which line1 intersects line2 doesn’t intersect line1, or line2”. Huh?
Let’s look at another example, this time a Point-in-Polygon query:
[php]DECLARE @square geometry = geometry::STPolyFromText(‘POLYGON((0 0, 10 0, 10 10, 0 10, 0 0))’, 0);
DECLARE @point geometry = geometry::STPointFromText(‘POINT(5.02 4.98)’, 0);
SELECT
@point.STIntersects(@square),
@point.STIntersection(@square).ToString();[/php]
Simple square polygon, ten units high by ten units wide, with a point roughly in the middle of it. Unsurprisingly, the STIntersects() method correctly reports that the two geometries intersect, but the point at which they intersect, given by STIntersection(), is stated as:
POINT (5.0199999809265137 4.9800000190734863)
We’d expect the point at which a Point intersects a Polygon to be exactly equal to the Point itself, yet there is a fractional difference in the coordinate values returned by STIntersection() than the original coordinates, 5.02 4.98, supplied. What’s interesting (as well as perhaps giving away a clue as to what is happening here) is that, as you increase the size of the square without changing the location of the point, the calculated point of intersection returned by STIntersection() gets less and less precise.
The following shows the point of intersection between the Point (5.02 4.98) and increasing-sized Polygons as returned by the STIntersection() method:
[php]POLYGON((0 0, 1000 0, 1000 1000, 0 1000, 0 0)) –> POINT (5.0200042724609375 4.9799957275390625)
POLYGON((0 0, 100000 0, 100000 100000, 0 100000, 0 0)) –> POINT (5.01953125 4.98046875)
POLYGON((0 0, 1E6 0, 1E6 1E6, 0 1E6, 0 0)) –> POINT (5.015625 4.984375)
POLYGON((0 0, 1E7 0, 1E7 1E7, 0 1E7, 0 0)) –> POINT (5 5)
POLYGON((0 0, 1E8 0, 1E8 1E8, 0 1E8, 0 0)) –> POINT (6 4)[/php]
The Explanation
So what’s going on here? It’s not the rounding issues caused by conversion from binary <-> decimal WKT explained earlier – that only occurs when new geometry data is instantiated from, or retrieved as, WKT. However, it is another type of conversion that happens internally…
Although SQL Server stores coordinates as floating point binary values, it performs spatial calculations using integer arithmetic. Floating point coordinates are, by the very nature of a floating point system, approximate, and floating point arithmetic is not “robust” – calculating the difference between two similar floating point values, for example, can create results containing errors with large orders of magnitude. Integer arithmetic, in contrast, is always exact and reliable, whatever the integer values supplied.
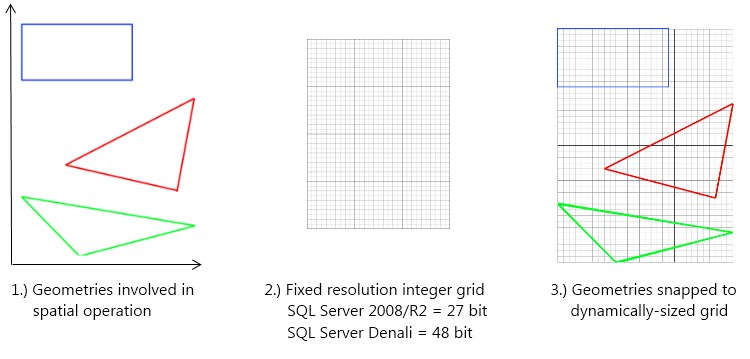
Therefore, in order to perform calculations on coordinates in a robust fashion, SQL Server first snaps those coordinates to an integer grid. Note that coordinate values are not simply converted to integer (which would lose any fractional precision), but they are snapped to the closest integer value on a dynamically-scaled integer grid. An analogy is to think back to mathematics lessons at school, in the days before MS Excel, when you had to draw graphs by hand on a piece of graph paper. The skill in drawing such graphs was to choose an appropriate scale – one in which each value in the underlying data could ideally be placed on a grid cell boundary, but subject to the fact that you had to get the whole range of data to fit on a fixed size piece of paper.
This is what SQL Server does with spatial calculations – it’s got an integer grid of fixed size (equivalent to the fixed size sheet of graph paper). In SQL Server 2008, this is a 27-bit grid. It then dynamically scales the coordinates involved in any particular operation to fit on this grid (the equivalent of choosing the scale for your graph), and each coordinate is snapped to the closest cell on the grid. Some results will lie exactly on a grid cell boundary, in which case the results returned by SQL Server will be exact but, in all other cases, the result will be subject to some error. The result of the integer calculation is then converted back into floating-point coordinates again, in the same scale as originally supplied.
The amount of error is determined by the overall scale (i.e. the size) of the geometries on which you are operating. The greater the range of coordinate values that must be covered by the grid, then the more coarse the grid resolution becomes, with each cell in the integer grid representing a larger value. This explains the effect demonstrated previously, whereby when the Polygon was of size POLYGON((0 0, 1E7 0, 1E7 1E7, 0 1E7, 0 0)) the coordinate values were snapped to the closest 0.25 unit. With a Polygon of size POLYGON((0 0, 1E8 0, 1E8 1E8, 0 1E8, 0 0)), coordinates were instead snapped to the closest 2 units.
Using a 27bit integer grid as in SQL Server 2008, on a line between the equator and the North Pole (10,000km), points will be snapped by no more than 10cm, which is pretty good accuracy for most applications.1 However, it means you should be very careful with interpreting results, especially if you are trying to test whether two instances are exactly equal (as in the STEquals() method). SQL Server Denali uses a 48bit grid, which effectively increases the grid resolution, meaning points will be snapped by a smaller amount, but still uses the same underlying method.
The Warm, Fuzzy Factor
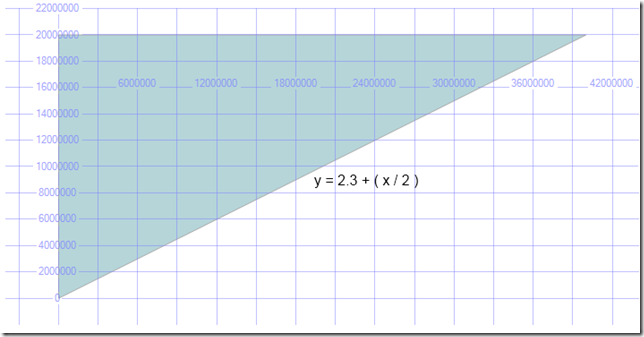
Consider the following example, which creates a large triangular Polygon and a Point close to, but just underneath that triangle:
[php]DECLARE @triangle geometry = geometry::Parse(‘POLYGON((0 2.2, 40000000 20000002.2, 0 20000002.2, 0 2.2))’);
DECLARE @point geometry = geometry::Parse(‘POINT(5 4.6)’);[/php]
The formula for the line of the hypoteneuse of the triangle is y = 2.2 + (x/2). The POINT(5 4.6) lies below this line so does not intersect the triangle.
However, if you ask SQL Server, you’ll get a different result. SQL Server reports that the Point does intersect the triangle:
[php]SELECT
@point.STIntersects(@triangle) AS IsThePointIntheTriangle — 1[/php]
Now, you may think that the reason for this incorrect result is because the effect of snapping to the integer grid has caused the point to snap “upwards” into the triangle. However, this is not actually the case – the scale of the Polygon in this example means that the integer grid snaps coordinates to 0.5 unit. The y coordinate of the Point is actually snapped downwards from 4.6 to 4.5 – moving it further away from the triangle.
[php]SELECT
@point.STIntersection(@triangle).ToString() AS SnappedPoint; — POINT (5 4.5)[/php]
The reason for the incorrect result in this case is because, in order to account for possible errors caused by the integer-snapping process, SQL Server adds a “fuzziness”-factor to certain operations. In a nutshell, when working only with the snapped Point value of POINT (5 4.5), SQL Server can’t be certain whether the original supplied Point intersects the triangle or not.
In this example, the supplied Point was POINT(5 4.6), which lies outside the triangle. However, the original point could have been POINT(5 4.72), which lies inside the triangle but, when snapped to an integer grid to the closest 0.5 unit, would also have been snapped to the same point POINT(5 4.5). Seeing as SQL Server can’t be certain whether the point lies inside or outside, it seems to apply a “fuzzy” tolerance equal to half the snapping-distance of the integer grid. If the snapped point lies within the tolerance of the other geometry, SQL Server plays on the safe side and assumes that it intersects it.
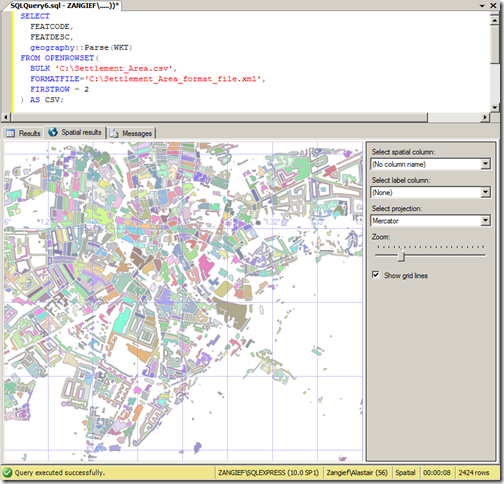
This fuzziness can produce false positive results, with geometries deemed to intersect each other (or, indeed, themselves) when in fact they don’t. This can be one reason why large, very detailed polygons can be rejected by SQL Server – their size forces a coarse integer grid to be used, but the level of detail then creates self-intersection to occur as points coincide when snapped to the grid.
