Bing Maps: SQL Server Denali CTP3

At the beginning of the week, there was a new version of the Bing Maps AJAX API rolled out (version 7.0.20110630165515.17). There’s a list of changes at http://msdn.microsoft.com/en-us/library/gg675211.aspx but, to summarise them here:

  • Directions and Traffic information (both features that were included in the core 6.x control) have been added back into v7 using the new optional module functionality.
  • New venue maps mode allows you to see layouts in the inside of shopping malls etc.(Haven’t seen much use for this yet – don’t know if it really exists outside the US)
  • You can now disable birdseye mode – very useful since it prevents you accidentally breaching the Terms of Use if not licensed to use it!
  • Polygons and polylines have a new dashstyle property, which means you can style vector shapes so that, for example, electricity lines and railways show as dashed lines (as in an Ordnance Survey map).

I’m particularly pleased about the last two features, since these are both things that I’ve suggested about on the MSDN forums… whether it’s coincidence or not, I’m glad they’ve now been implemented.

SQL Server Denali CTP3

A download link to the latest preview version of SQL Server was announced on Twitter, and a rapid rush of tweets followed as people clammered to see what new features were included.

image

I’m only interested in summarising changes for the spatial toolset, which as far as I’ve found out so far, are as follows:

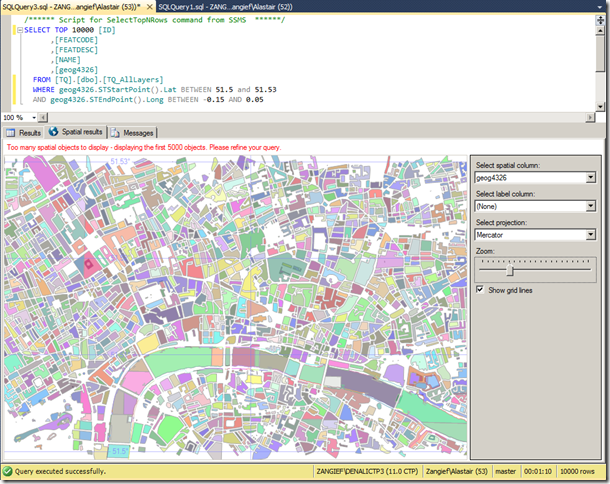
Firstly, the Spatial Results tab is back! Introduced in SQL Server 2008, broken in CTP1, and back again, it’s everyone’s favourite quick way of visualising geometry or geography data. The 5,000 object limit still seems to be in place:

image

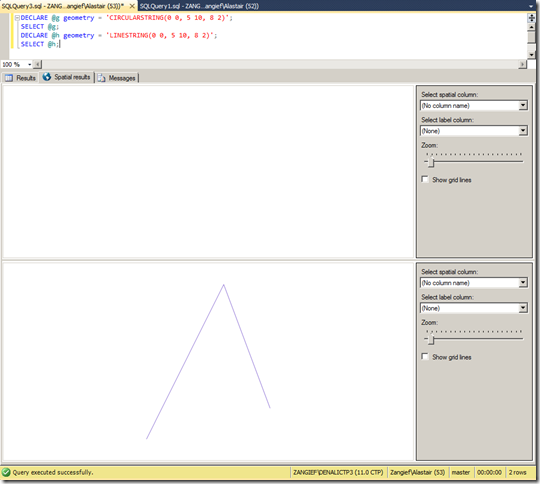
My next test was to see whether it could plot the new curved geometry types. Initial results were disappointing, when selecting a CircularString resulted in nothing but a white screen, while a LineString drawn between the same set of points was displayed as expected:

image

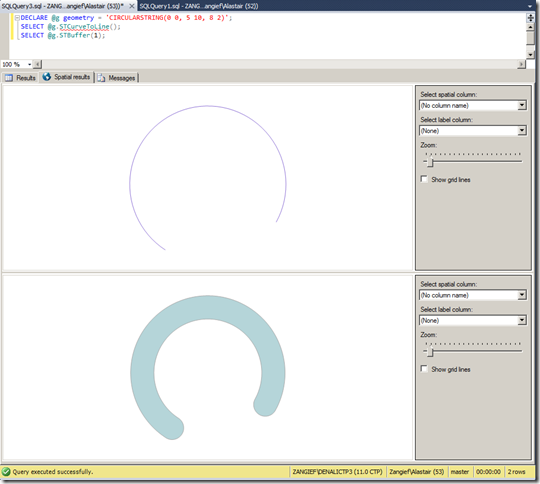
This same problem occurred across all curved geometry types – to display a curved geometry in the spatial results tab, it seems you have to linearise it first – for example, using STCurveToLine(), or creating a linear buffer around it using STBuffer() as shown here:

image

(Note that, although these features look curved, they’re really just a many-sided LineString and Polygon, respectively). Hopefully displaying true curved features will make it into the next release.

As for new functionality, there’s a new extended method, IsValidDetailed() – which tells you not only whether a geometry is valid (which is what the OGC STIsValid() method does), but why it’s invalid. Here’s an example script to test it:

DECLARE @g geometry = 'LINESTRING(0 0, 5 10, 8 2)';
DECLARE @h geometry = 'LINESTRING(0 0, 10 0, 5 0)';
DECLARE @i geometry = 'POLYGON((0 0, 2 0, 2 2, 0 2, 0 0), (1 0, 3 0, 3 1, 1 1, 1 0))';
SELECT
  @g.STIsValid() AS STIsValid, @g.IsValidDetailed() AS IsValidDetailed
UNION ALL SELECT
  @h.STIsValid(), @h.IsValidDetailed()
UNION ALL SELECT
  @h.STIsValid(), @i.IsValidDetailed()

And this is the output – which is much more useful when it comes to fixing invalid data than a simple Boolean obtained from STIsValid():

image

As with some of the updates to the Bing Maps control, I was particularly pleased to see this feature get included since it was something I’d raised in the MSDN forum – Microsoft are certainly scoring lots of points with customer responsiveness with me this week!

The only other functional addition I could see was the AsBinaryZM() method, which retrieves the Well-Known Binary of a geometry, complete with Z values. Previously, the only way to retrieve (or input) geometries containing Z and M values was via Well-Known Text, since the WKB representation stored 2d coordinates only.

The new method works pretty much as you’d expect, and the resulting serialised value also demonstrates some of the flags indicating this geometry has Z values:

DECLARE @g geography = 'POINT(1.6 52.5 100)';
SELECT
  @g.STAsBinary(),
  @g.AsBinaryZM()

Ordnance Survey And Colour-Blind Map Style

Ordnance Survey regular (left) and colour-blind (right) colour templates


The Ordnance Survey Blog has announced a colour scheme that accomodates people with colour vision deficiency (CVD) — i.e., colour-blindness. “Rather than creating separate colour schemes for those with various forms of CVD and those without, we were working on a colour palette that would work for everyone. Well a year later and we think we’ve cracked it and are now close to releasing a colour scheme for use with OS VectorMap Local, our customisable digital mapping product.” Above left, their regular scheme; above right, the new CVD-friendly scheme.

SQL Server: Easy Bulk Loading OS Locator Road Data

I’ve just loaded the Ordnance Survey “OS Locator” dataset (part of Ordnance Survey Open Data) into SQL Server 2008. OS Locator contains details of all the roads in Britain, in a gazetteer-style format. It is a 120Mb delimited text file, containing details of around 790,000 road entities (some roads are split into multiple entities if they cross districts etc.) – including the road name, the coordinates of its bounding box and centrepoint, classification, and the county and area in which it is located. (Note that this dataset doesn’t include the geometry of the shape of the road itself). You can find the technical specifications for the OS Locator dataset here: http://www.ordnancesurvey.co.uk/oswebsite/products/oslocator/docs/user_guide.pdf

Since the file is text-based, there’s a range of options available to import it – you could create an SSIS package, or use the import/export wizard, or one of a variety of third party ETL tools. However, for an absolutely dead-easy way to query the data and create a geometry point representing the centre of each road using purely T-SQL, I used the OPENROWSET bulk function in conjunction with a format file.

Not only is this method easy, but it’s utterly repeatable so (assuming the structure of the source data remains constant) you can run it again each time the underlying data gets refreshed. OPENROWSET allows you to query the text file source directly, as if it were a table in the database, from which you can SELECT columns of data, INSERT them into other tables etc.

The following shows the xml format file I used to specify the columns of data in the OS Locator file:

[php]<?xml version="1.0"?>
<BCPFORMAT xmlns="http://schemas.microsoft.com/sqlserver/2004/bulkload/format" xmlns:xsi="http://www.w3.org/2001/XMLSchema-instance">
<RECORD>
<FIELD ID="0" xsi:type="CharTerm" TERMINATOR=":"/>
<FIELD ID="1" xsi:type="CharTerm" TERMINATOR=":"/>
<FIELD ID="2" xsi:type="CharTerm" TERMINATOR=":"/>
<FIELD ID="3" xsi:type="CharTerm" TERMINATOR=":"/>
<FIELD ID="4" xsi:type="CharTerm" TERMINATOR=":"/>
<FIELD ID="5" xsi:type="CharTerm" TERMINATOR=":"/>
<FIELD ID="6" xsi:type="CharTerm" TERMINATOR=":"/>
<FIELD ID="7" xsi:type="CharTerm" TERMINATOR=":"/>
<FIELD ID="8" xsi:type="CharTerm" TERMINATOR=":"/>
<FIELD ID="9" xsi:type="CharTerm" TERMINATOR=":"/>
<FIELD ID="10" xsi:type="CharTerm" TERMINATOR=":"/>
<FIELD ID="11" xsi:type="CharTerm" TERMINATOR=":"/>
<FIELD ID="12" xsi:type="CharTerm" TERMINATOR=":"/>
<FIELD ID="13" xsi:type="CharTerm" TERMINATOR=":"/>
<FIELD ID="14" xsi:type="CharTerm" TERMINATOR=":"/>
<FIELD ID="15" xsi:type="CharTerm" TERMINATOR="\r\n"/>
</RECORD>
<ROW>
<COLUMN SOURCE="0" NAME="Name" xsi:type="SQLVARYCHAR"/>
<COLUMN SOURCE="1" NAME="Classification" xsi:type="SQLVARYCHAR"/>
<COLUMN SOURCE="2" NAME="Centx" xsi:type="SQLINT"/>
<COLUMN SOURCE="3" NAME="Centy" xsi:type="SQLINT"/>
<COLUMN SOURCE="4" NAME="Minx" xsi:type="SQLINT"/>
<COLUMN SOURCE="5" NAME="Maxx" xsi:type="SQLINT"/>
<COLUMN SOURCE="6" NAME="Miny" xsi:type="SQLINT"/>
<COLUMN SOURCE="7" NAME="Maxy" xsi:type="SQLINT"/>
<COLUMN SOURCE="8" NAME="PostSector" xsi:type="SQLVARYCHAR"/>
<COLUMN SOURCE="9" NAME="Settlement" xsi:type="SQLVARYCHAR"/>
<COLUMN SOURCE="10" NAME="Locality" xsi:type="SQLVARYCHAR"/>
<COLUMN SOURCE="11" NAME="Cou_Unit" xsi:type="SQLVARYCHAR"/>
<COLUMN SOURCE="12" NAME="LocalAuth" xsi:type="SQLVARYCHAR"/>
<COLUMN SOURCE="13" NAME="Tile_10k" xsi:type="SQLVARYCHAR"/>
<COLUMN SOURCE="14" NAME="Tile_25k" xsi:type="SQLVARYCHAR"/>
<COLUMN SOURCE="15" NAME="Source" xsi:type="SQLVARYCHAR"/>
</ROW>
</BCPFORMAT>[/php]

Assuming that the format file above is saved as c:OSLocator_formatfile.xml, and the OS Locator download itself is saved as c:OS_Locator2010_2_Open.txt (the filename of the most recent locator download at the time of writing), then you can load the Locator dataset directly in SQL Server, creating a geometry point at the centre of each road in a single query as follows:

[php]SELECT *,
geometry::Point(Centx,Centy,27700) AS Centre
FROM OPENROWSET(
BULK ‘C:OS_Locator2010_2_Open.txt’,
FORMATFILE=’C:OSLocator_formatfile.xml’
) AS CSV;[/php]

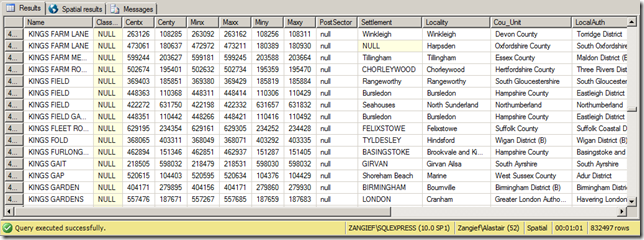
And here’s what the data looks like:

image

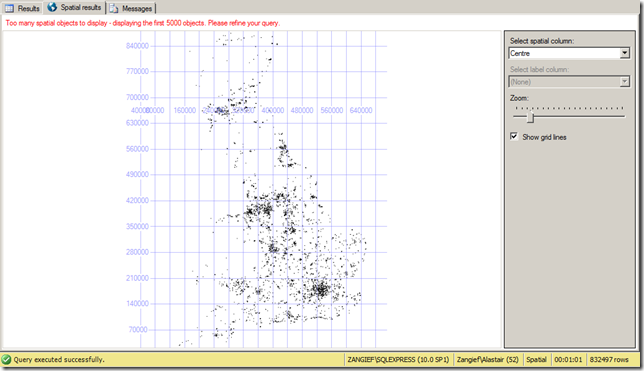
Here’s the spatial results tab displaying the centre points of the first 5,000 rows of data:

image

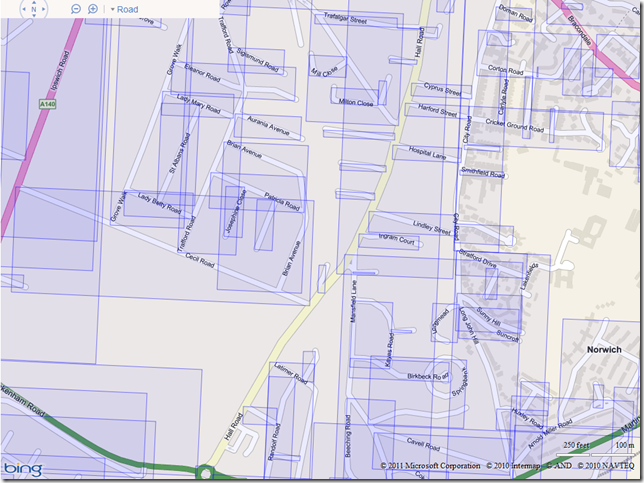
And here’s what a small section of Norwich looks like having created a bounding box from the min/max coordinates of each road and overlaying them on Bing Maps (having first transformed the coordinates from EPSG:27700 to EPSG:4326):

image