Apple WWDC 2009 Keynote presentation, highlighting the announcement by Peter-Frans Pauwels, CTO of TomTom.
Mapping History with Google Maps
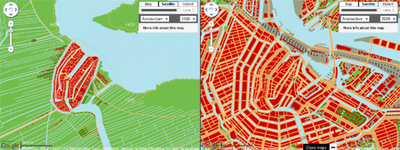
Maps+Motion is a great way to visualise the growth of Dutch cities and Manhattan in New York with Google Maps.
Essentially the application allows you to view side-by-side the modern maps of cities with maps of how the cities looked at different times in history. The screenshot above, for example, shows a map of 1450 Amsterdam with a modern map of the city.
The application currently allows you to view the historical growth of Den Haag, Harrlingen, Amsterdam, Leiden, Rotterdam and Zuiderzee in the Netherlands and Manhattan in the USA.
The NSW Interactive Atlas
The Atlas of New South Wales is an initiative of the Land and Property Management Authority and it was created with the objective of providing detailed statistics across a range of topics to educational institutions and the broader community. It is built with Bing Map so, provides very familiar to many, simple and intuitive interface to government information.
All the information is presented as a series of thematic map overlays in four categories:
- People (eg. population, health, housing, religion, indigenous population, indexes of relative advantage/disadvantage, crime);
- Economy (eg. labour force, taxation and revenue, and production of fruit and vegetables, oils and grins, and livestock);
- History (eg. information on settlement, State elections and boarders); and
- Environment (including vegetation, geology and soils, and locations of national parks).
Users have a choice between satellite image or roads map as a base layer and can adjust transparency level of thematic overlays. Each overlay is accompanied by a comprehensive legend, explaining the meaning of presented data. A click on individual region brings up a pop-up window with information about the region, presented as charts and gauges.

The Atlas of New South Wales is quite responsive considering the amount of data that is required to present thematic overlays. It would benefit though from a bit more legible charts and access to source data in a tabular format and/ or for download. Overall, the application is well built and very simple to navigate through.