GIS Cloud
 GIS Cloud is a powerful free cloud based GIS service, that allows users to create, edit, analyze and publish data from only one GIS service. When creating a map with GIS Cloud users can choose from a number of base tiles, including OpenStreetMap, Bing Maps and Google Maps. Users can then add GIS data to the map, either from data already hosted on GIS Cloud or from their own files. Because the application is web based GIS Cloud enables centralised access to projects. Teams can work together on a project, with each member having their own account. Any changes then made to a project are available immediately to every member of the team. GIS Cloud projects can be shared, either by sharing the GIS Cloud URL of the project or by embedding the map in your own website. GIS Cloud also comes with a REST API and a JavaScript API.
Street View Image API
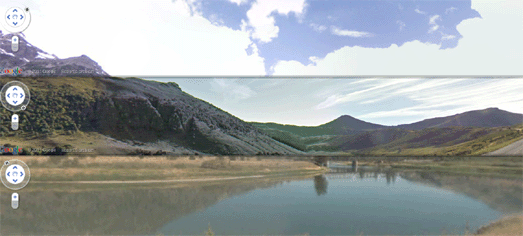
Google has released a Street View Image API to quickly and easily add a static image to a web page. The API provides a simple method for adding a Street View image or thumbnail to any application without the need for JavaScript. The API simply constructs a URL for the required Street View, which you can add to a web page as you would any other image. The API returns the corresponding Street View panorama as an image in JPG format. A quick example is the Street View of the Eiffel Tower above, which I added to this post with the URL http://maps.googleapis.com/maps/api/streetview?size=523×200&location=48.852733, 2.303183&heading=315&fov=90&pitch=5&sensor=false The API should prove very useful in particular for real-estate, hotel and restaurant listing sites, providing a quick and easy method for providing images of houses, hotels and restaurants.
DVRPC Pedestrian and Bicycle Counts
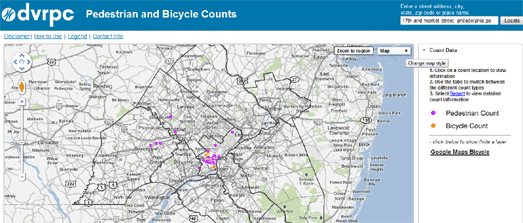 The Delaware Valley Regional Planning Commission collects traffic volume counts at over 5,000 locations each year. The DVRPC Pedestrian and Bicycle Counts Google Map allows users to select and view pedestrian and bicycle counts taken within the Philadelphia region. The data for the map was collected by the DVRPC over a one week period with detailed hourly reports linked to each location. Using the map it is therefore possible to view bicycle and pedestrian traffic at different locations in the city for the year in which it was collected. If you select an individual map marker you can click through to read a detailed report of the pedestrian or bicycle count at that location, showing the data for every hour within a one week period.
savethepostoffice.com map
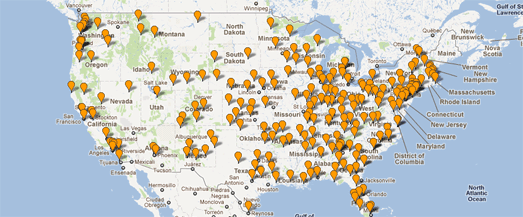 The U.S. Postal Service announced this week that it will be studying 251 mail processing facilities for consolidation. If all of these plants were to close, it would reduce the area mail processing network by over half, presumably at a huge cost to delivery times. The website Save the Post Offices has created a Google Map showing the location of the 251 mail processing facilities that may be closed down, Processing Facilities Under Study for Consolidation Map. Save the Post Offices has also created Google Maps to show the location of Post Offices Closed in 2011, 3,653 Post Offices Under Study for Closure under RAOI and 727 (non-RAOI) Post Offices Under Study for Discontinuance.
Obsidian Portal
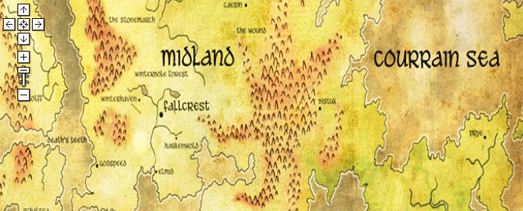 Obsidian Portal is an online platform for running and organizing table top role-playing games. Using the platform gamers can can build campaigns and find other RPG gamers. The platform also includes an option to easily create a Google Map of your campaign world. Users can create campaign maps from any JPEG image. The map can include map markers to show the position of cities or other important locations in a campaign. The map markers can also include links to a users Wiki page for the mapped location.
Digital Typhoon – Track Forecast Map
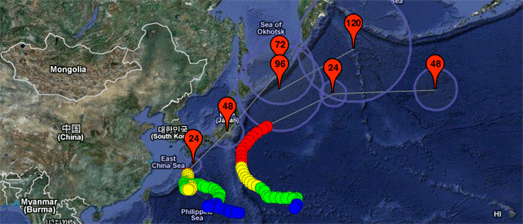
Agora’s Digital Typhoon – Track Forecast Map tracks tropical cyclones in and around Japan. The map shows the historical tracks of current typhoons and also shows their predicted path.
The map is currently showing the paths of typhoon Roke and Sonca. When the map first loads an animation of the typhoons’ path is displayed on the map. Different coloured markers indicate the typhoon’s wind speed at different points along its path.
The numbered red map markers show the predicted path of a typhoon. Each marker includes a radial polyline showing the probability circle of the typhoon’s location. You can also click on the markers to view the predicted wind speed.
Submarine Cable Map
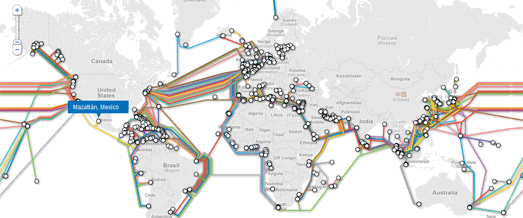
TeleGeography’s Submarine Cable Map is a real thing of beauty.
The map depicts 188 active and planned submarine cable systems and their landing stations around the world. Both the cables and their landing points on the map are interactive. Clicking a cable provides access to data about the cable, including the cable’s name, ready-for-service (RFS) date, length, owners, website, and landing points. Clicking a landing point reveals a list of all submarine cables landing at that station.
The map makes great use of Google Map styles and custom info windows to create a map that is both functional and great to look at.
Planefinder.net
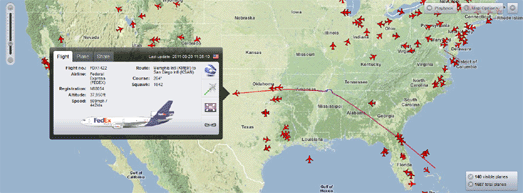
Planefinder.net, the real-time plane tracking website, has made some very impressive updates to their Google Map.
Now as well as tracking thousands of planes in real-time around the world you can also play back a whole day’s worth of flights. The playback option allows you to select a date, the number of hours you wish to view and even the speed of the animation. You really should zoom out on the USA, set the time to 23 hours and the speed to 120x and watch a day’s worth of flights.
Another nice update in this new release of planefinder.net is the custom information windows. If you select an individual plane you can view a picture of the plane, the flight and flight details, download a KML of the flight path, zoom the map to fit the entire flight path and share the track on Twitter and Facebook.
Google Map of Speed Traps
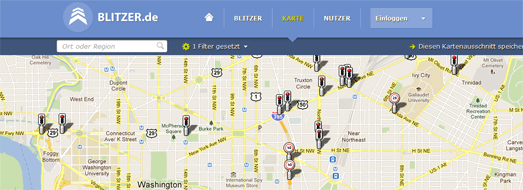
Blitzer.de is a new Google Map, and Android & iPhone app which has a huge database of speed traps around the world.
Blitzer.de is the latest application from the ever impressive Ubilabs. The app allows you to view the location of speed traps in your region and around the world. More than 2,000 mobile speed traps are reported by the blitzer.de community per day.
The application allows users to search by location and filter results by fixed speed traps, mobile cameras and all speed traps. The speed trap markers include speed limits where available. Users of the map and the mobile apps can also add speed traps that are missing from the map.
via:googlemapsmania