You may recall seeing this great visualization from Facebook last week on the links between friends. Well the creator of that graphic has blogged about how he did it using R and some amazingly simple processing. R is one of those tools that isn’t used in our space enough (really, you use Excel for analysis?) and if this doesn’t open your eyes to its great potential, your priorities are in the wrong place.
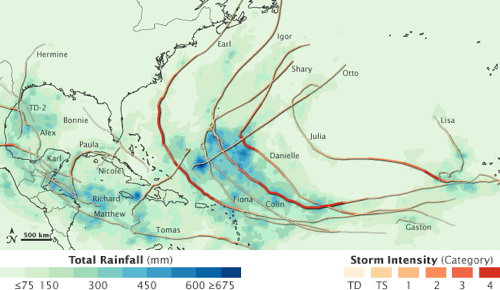
Hurricanes in 2010

NASA Earth Observatory has a map of hurricane tracks, rainfall and storm intensity for the 2010 season. “This image shows the paths taken by the storms and the rainfall associated with each storm throughout the season. The rainfall measurements are from the Multisatellite Precipitation Analysis, which is based on data from the Tropical Rainfall Measuring Mission (TRMM) satellite. Although most of the major storms missed the continental United States, curving back out to sea instead, hurricanes and tropical storms did major damage to Haiti, eastern Mexico, and Central America.”
From Buildings to Cities: Techniques for the Multi-Scale Analysis of Urban Form and Function
Duncan Smith here at CASA and Andrew Crooks, an assistant professor in the Department of Computational Social Science, at George Mason University have just finished a new working paper entitled ” From Buildings to Cities: Techniques for the Multi-Scale Analysis of Urban Form and Function .” Below is the abstract : The built environment is a significant factor in many urban processes, yet direct measures of built form are seldom used in geographical studies. Representation and analysis of urban form and function could provide new insights and improve the evidence base for research. So far progress has been slow due to limited data availability, computational demands, and a lack of methods to integrate built environment data with aggregate geographical analysis.
