Google Earth: New Imagery – May

Less than two weeks after their previous update, it appears that Google has just pushed out some more fresh imagery to Google Earth. Thanks to ‘Munden’ for letting us know about it!

minneapolis.jpg

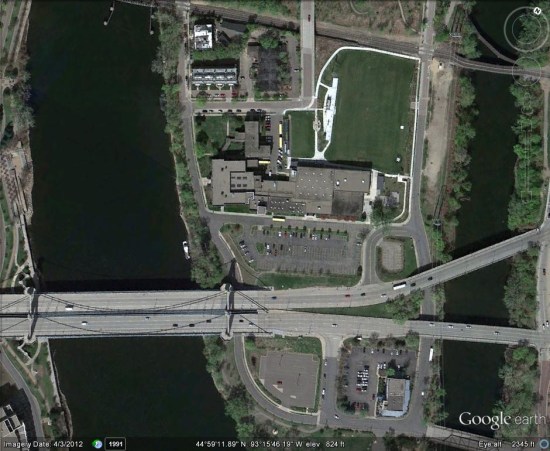
As is almost always the case, you can use Google Maps to determine for sure whether or not a specific area is fresh. This new imagery isn’t in Google Maps yet, so you can compare Earth vs. Maps to see what’s new; the fresh imagery is already in Google Earth, but the old imagery is still in Google Maps. If you compare the two side-by-side and they’re not identical, that means that you’ve found a freshly updated area in Google Earth!

  • United States: Illinois (Neoga, Quincy), Michigan (Traverse City), Minnesota (Minneapolis, St. Paul), Ohio (Akron, Cleveland, Youngstown), Pennsylvania (State College)

The Geo Teachers Institute

For years, Google’s geo products have been identified as a powerful learning toolkit that can help students conceptualize, visualize, share, and communicate information about the world around them.

This fall, we will host two Google Geo Teachers Institutes: September 23 and 24, 2011 in Washington DC at National Geographic Headquarters and September 26 and 27, 2011 at the University of Southern Maine Lewiston-Auburn College in Lewiston, Maine.

This event is a free professional development experience designed to help educators get the most from Google’s geo products and technologies. The Geo Teachers Institute is an intensive, two-day event where participants get hands-on experience using Google Earth, Google Maps, and Google SketchUp, including a focus on features like Ocean, Mars, Moon and Sky in Google Earth.

Attendees will learn about innovative instructional strategies and receive resources to share with colleagues. The Google Geo Education team hopes this event will empower educators to bring the world’s geographic information to students in a compelling, fresh, and fun way.

If you are interested, please complete this application. You will be notified if you are selected by August 15, 2011. Even if you can’t make it to this event, we have many online resources available for Google Earth and SketchUp and encourage you to check them out.

Google Earth: Baseline to baseline, we’ve got the basketball games covered

Do you hear the dribble on the court and the chanting of the fans? Following an action-packed week of buzzer beaters, the 2011 NCAA® Championship here in the U.S. promises to be as exciting as ever.

As a college hoops fan, I often wish I could experience the games sitting in the arenas—and I’m sure I’m not alone. This year, our college basketball tournament map lets you get as close as you can to the games without leaving your desk thanks to 3D models of the tournament’s 14 arenas. Take a virtual tour of the venues by watching the video below, or download this tour and open it in Google Earth.

Plus, we’ve created a special page for you to keep track of all the excitement during the next few weeks. You can see an up-to-date tournament schedule, explore the college campuses in Street View and click through to watch the actual games on NCAA® March Madness on Demand®. You can also create a bracket using Google Docs, read Google News articles on the games and download basketball apps from the Chrome Web Store. It’s all here (along with a fun surprise) at www.google.com/collegebasketball2011.

And since there’s been a long-running debate over whether teams playing closer to their home court have an advantage, we added a “Distance Tool” on the map to make it easier to measure how far schools have to travel from game to game. We’ll see how things play out, but the defending champion Duke Blue Devils may have to travel more than 2,000 miles to Anaheim if they win their first two games.

As my friends always say when we can’t wait for the tournament to begin, “Send it in, Jerome!” May your favorite school reach the finals and we hope you enjoy all the basketball fun at www.google.com/collegebasketball2011.

Posted by Aaron Weissman, Google Maps Marketing (San Francisco King of the Rock winner)

Record Melt in Greenland in 2010

Record Melting in Greenland during 2010 NASA Earth Observatory has a map showing the record melt of Greenland’s ice cap in 2010, during which the melt started earlier and lasted longer than usual. “This image was assembled from microwave data from the Special Sensor Microwave/Imager (SSM/I) of the Defense Meteorological Satellites Program. Snow and ice emit microwaves, but the signal is different for wet, melting snow than for dry. Marco Tedesco, a professor at the City College of New York, uses this difference to chart the number of days that snow is melting every year. This image above shows 2010 compared to the average number of melt days per year between 1979 and 2009.”

Sign up for imagery update alert

Users in the Google Earth forum often ask about the age of satellite imagery and when the content will be updated. While we aren’t able to tell you in advance when our imagery will be updated, we can now notify you after new images are added to an area that you’re interested in.

With our Follow Your World application, you can register points on the globe and we’ll send you an email update whenever the imagery is updated there.

In just three easy steps, you can add points such as your hometown, your college football stadium, or just about any place on Earth. And since Google Earth and Google Maps share the same imagery, this tool is equally handy for enthusiasts of both products. Follow Your World also provides a handy dashboard to manage your subscriptions.

Whether you’re an armchair geospatial enthusiast, or you frequently use aerial imagery from Google Earth or Google Maps in your work, we invite you to give this new app a try so you’ll be the first to know.