Sea Ice Extent updated for 2011


As they’ve done for the past few years (here is 2010), the National Snow and Ice Data Center (NSIDC) has produced their annual Sea Ice Extent data


extent-2011.jpg 

While 2011 wasn’t a record year for ice loss, it came close, ending just slightly above the mark set in 2007. You can view the data for yourself by loading this KMZ file.

Here are the details for this year:

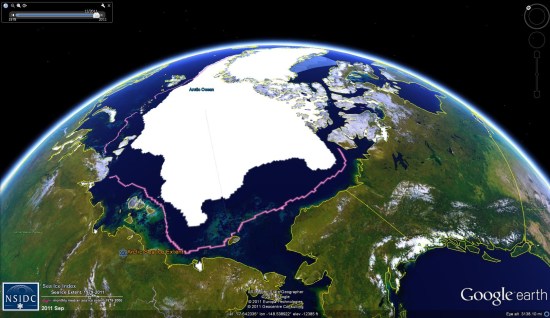
Average ice extent for September 2011 was 4.61 million square kilometers (1.78 million square miles), 2.43 million square kilometers (938,000 square miles) below the 1979 to 2000 average. This was 310,000 square kilometers (120,000 square miles) above the average for September 2007, the lowest monthly extent in the satellite record. Ice extent was below the 1979 to 2000 average everywhere except in the East Greenland Sea, where conditions were near average.

As in recent years, northern shipping routes opened up this summer. The Northern Sea Route opened by mid August and still appeared to be open as of the end of September. The southern “Amundsen Route” of the Northwest Passage, through the straits of the Canadian Arctic Archipelago, opened for the fifth year in a row. Overall, sea ice in the wider and deeper northern route through Parry Channel reached a record low, according to Stephen Howell of Environment Canada, based on Canadian Ice Service analysis. Parry Channel had a narrow strip of ice that blocked a short section of the channel, but it did appear to open briefly in early September.


The New KML features in Google Earth 6.1

In the recently released Google Earth 6.1 we added two new features that will help you annotate line data and improve KML Tours that include Street View mode. As a part of Google’s ongoing commitment to innovation within the standard, these were added to the gx: namespace using the official extension mechanism for OGC KML.


Line labels

When Earth 6.0 launched last November we introduced line styling options to create more realistic roads that have a physical width, outer coloring, and text labels. Now with Google Earth 6.1 you can also add simple text labels at the midpoint of regular (screen <width>) lines by using the new <gx:labelVisibility> tag in <LineStyle>.

Caption: Labeled line between SFO and LAX airports.

Download the KML.


Note: To preserve the current, unlabeled appearance of regular lines in existing KML files, we’ve turned off all line labels by default in Google Earth 6.1. Because labels for physical width lines were turned on by default in Earth 6.0, you will now need to explicitly enable in your LineStyles to display them in Earth 6.1+.


Better Street View experience in Tours

Last November we also introduced <gx:ViewerOptions> in Earth 6.0 so that KML Tours can activate the historical imagery, sunlight and Street View modes, allowing you to tell even cooler stories.

Street View mode uses a different field of view (FOV) than the regular navigation mode to provide users with a better experience. However, until now this special FOV was not captured while creating Tours in Google Earth. This meant that tour playback couldn’t faithfully reproduce the Street View experience as originally recorded.

To address this issue in Google Earth 6.1 we added the <gx:horizFov> tag to <Camera> and <LookAt>. These values are captured automatically while recording tours in Earth 6.1 but you can also add them directly to your KML.


Caption: Here’s an example of using to create the classic dolly zoom effect, invented by cameraman Irmin Roberts and used in Alfred Hitchcock’s film Vertigo. Download the KML here.

Note: Although Cameras and LookAts can also be used to provide a default view for your placemarks, please note that in Google Earth 6.1 custom FOV values are only respected within the <gx:FlyTo> tags in tours.


School Projects, Geospatial Data and Content Management


WeoGeo has over 8 terabytes of free and inexpensive data available in the WeoGeo Market for inclusion in your analysis. Just this week we uploaded some great data from the State of Hawaii on Hawaiian Natural Areas and data from the Center for Disease Control and Prevention on U.S. Diabetes and Risk Factor Prevalence.

Hawaiian Natural Areas

We’ve also have the complete USGS National Hydragraphy Dataset and USGS Earthquake, Fault and Seismic Hazard data available for customization. Bonus points for using the WeoGeo Tools for ArcGIS to import these datasets into your ArcMap projects.

Another great option for students is our WeoGeo Library. Generally after the end of the school year, students need to archive off their projects to some personal stoarge device. Students using WeoGeo Library know their projects are available semester after semester no matter where they are. Since WeoGeo Library is a system of record, you’ll always have them at hand. My masters thesis was stored on a Brother Word Processor which meant that the minute I lost access to that hardware device, I lost all my hard work 2. That’s why a real geospatial content management system like WeoGeo is the best way to manage your school work. Plus you can get started today, for free.

Browsing WeoGeo