How the Google Maps API limits affect your site

Several weeks ago we shared an update about the introduction of usage limits to the Google Maps API. Today I’d like to provide additional details about these limits, the types of sites that may be affected, and as promised, equip you with the means for measuring your site’s Maps API usage.

Usage limits and affected sites

Usage limits are being introduced to secure the long term future of the Maps API, while minimising the impact on developers. We have purposefully set the usage limits as high as possible – at 25,000 map loads per day – to minimise the number of affected developers, while ensuring that the service remains viable going forward. Based on current usage, only the top 0.35% of sites will be affected by these limits, meaning that the Google Maps API will remain free for the vast majority of sites.

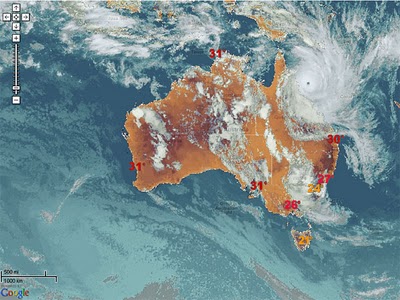
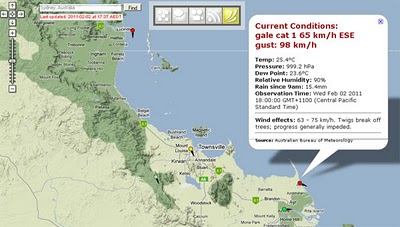
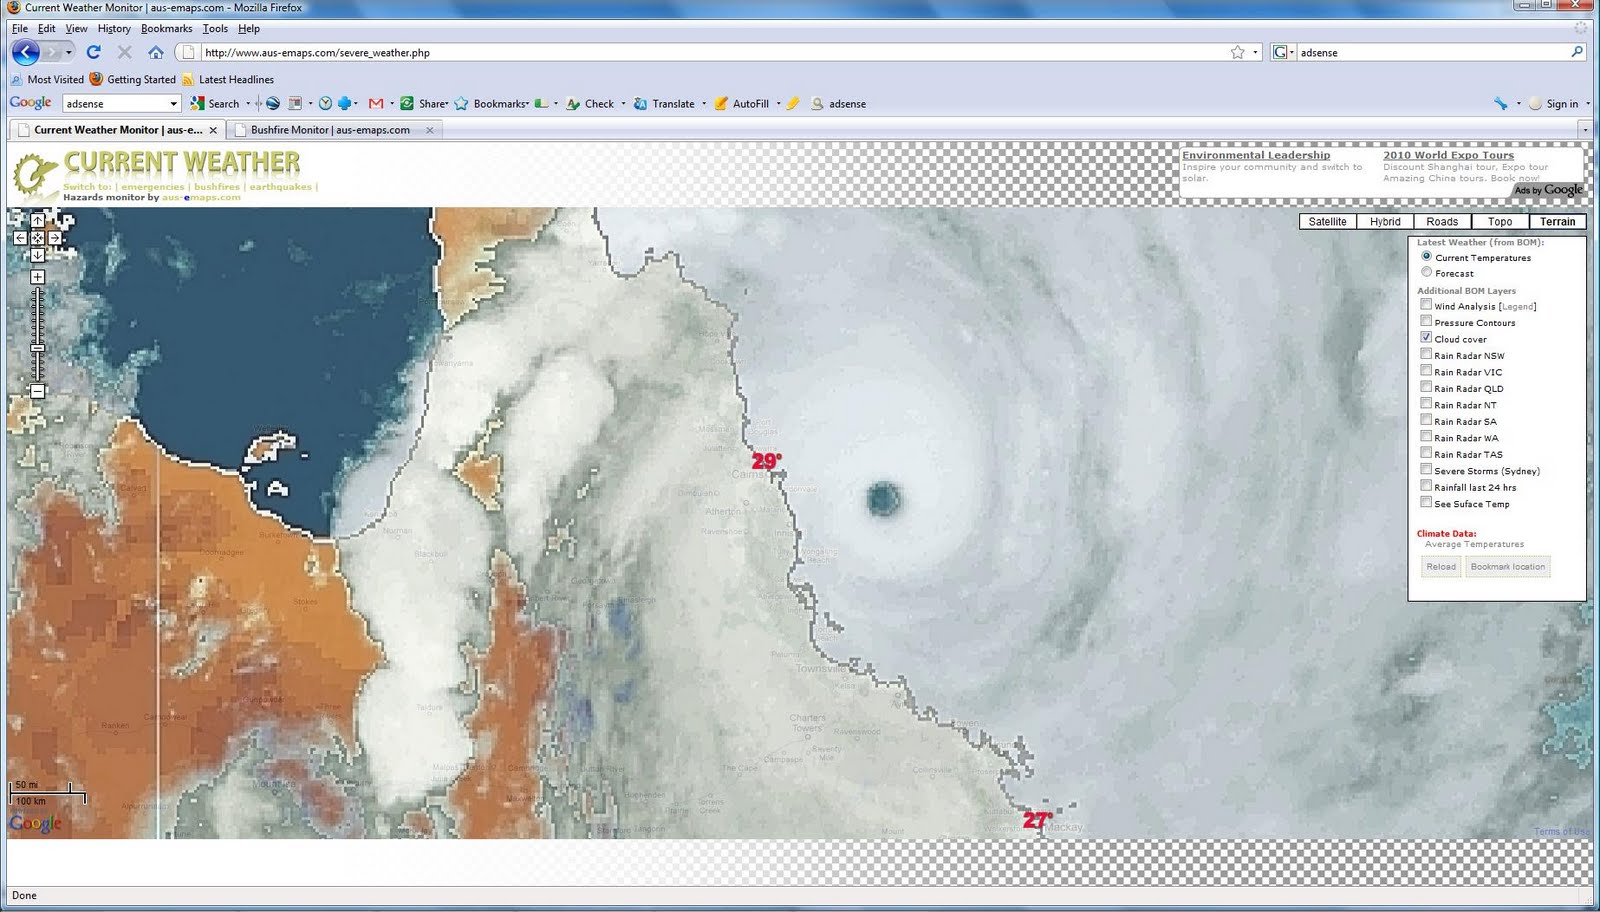
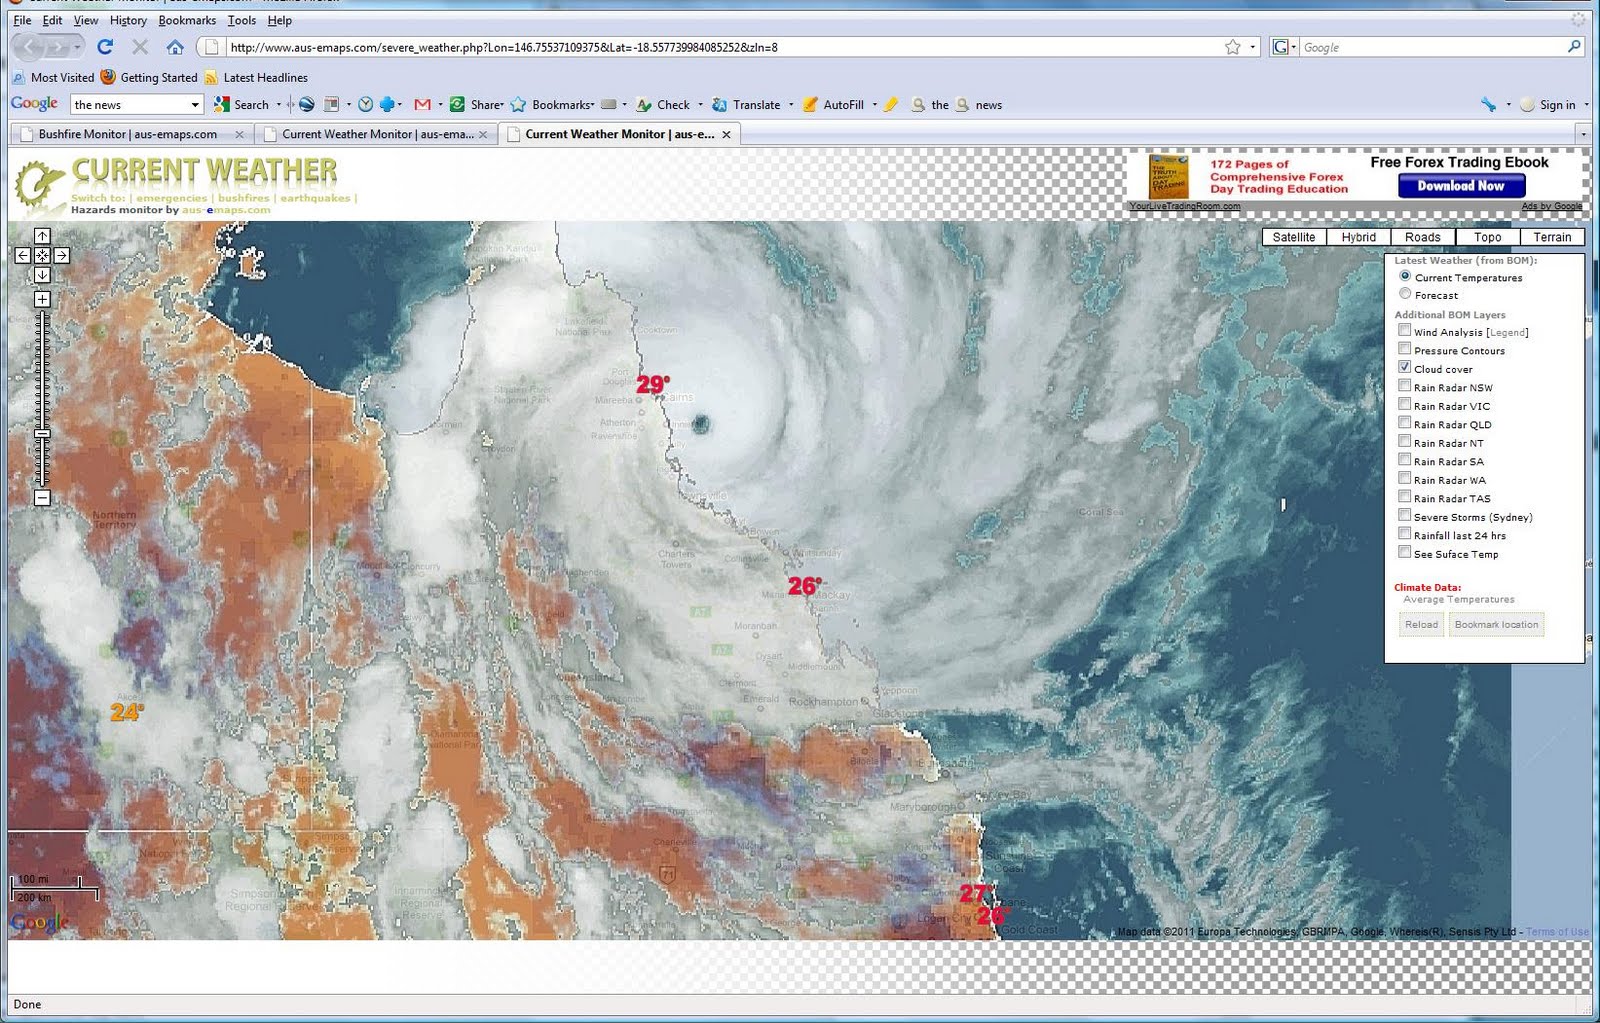
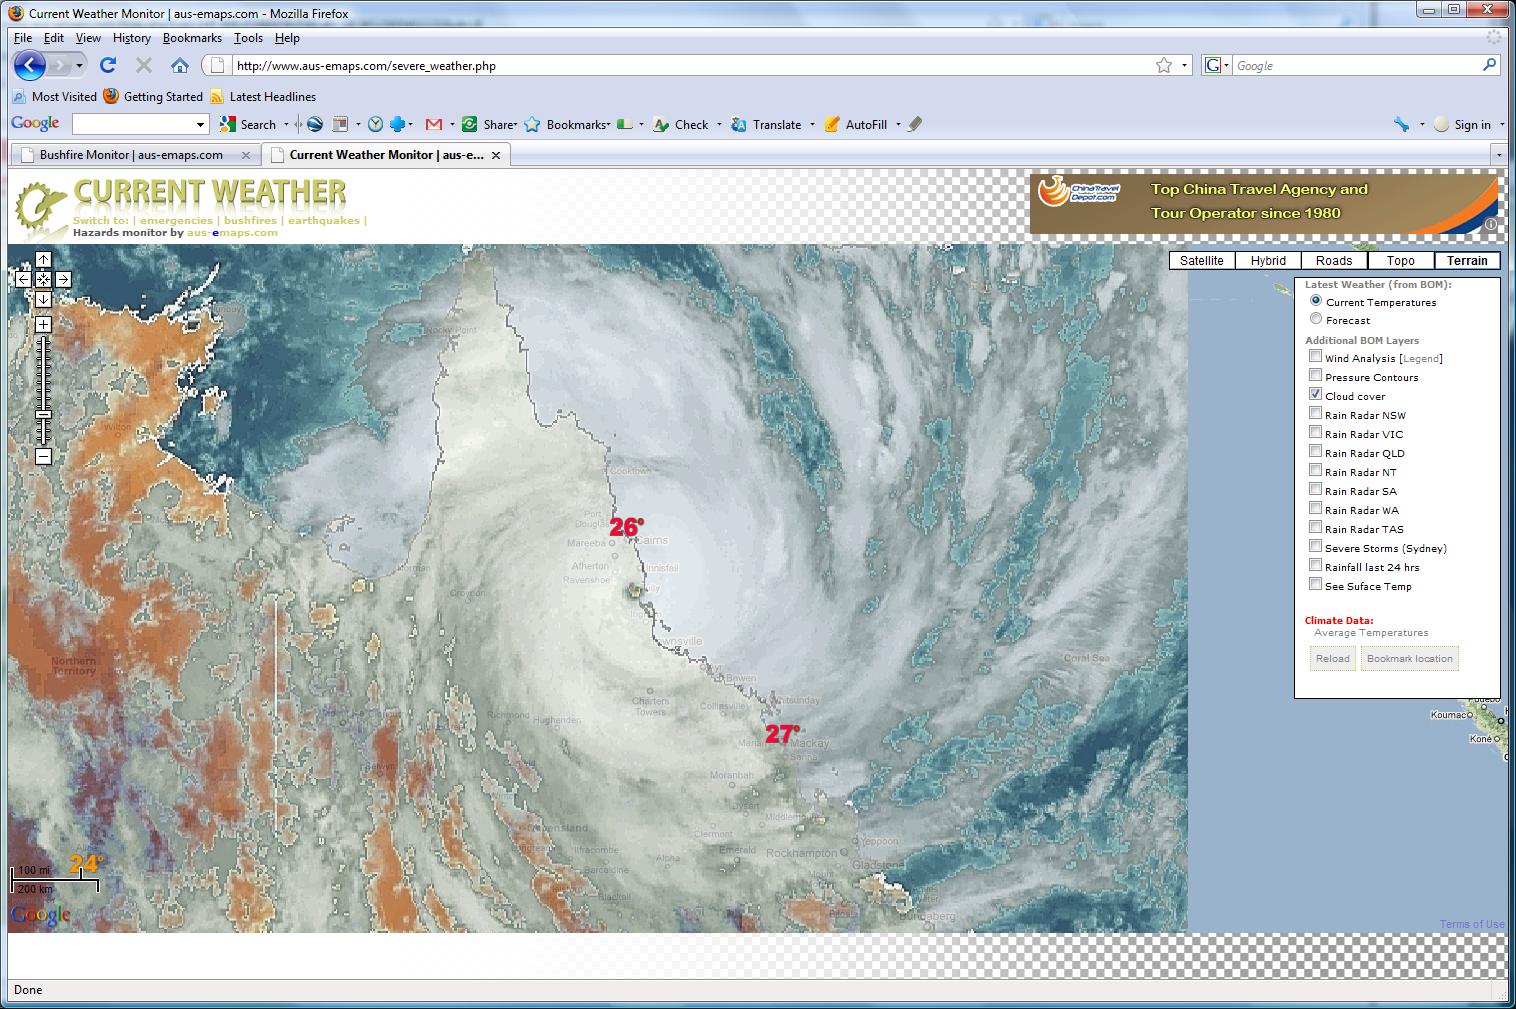
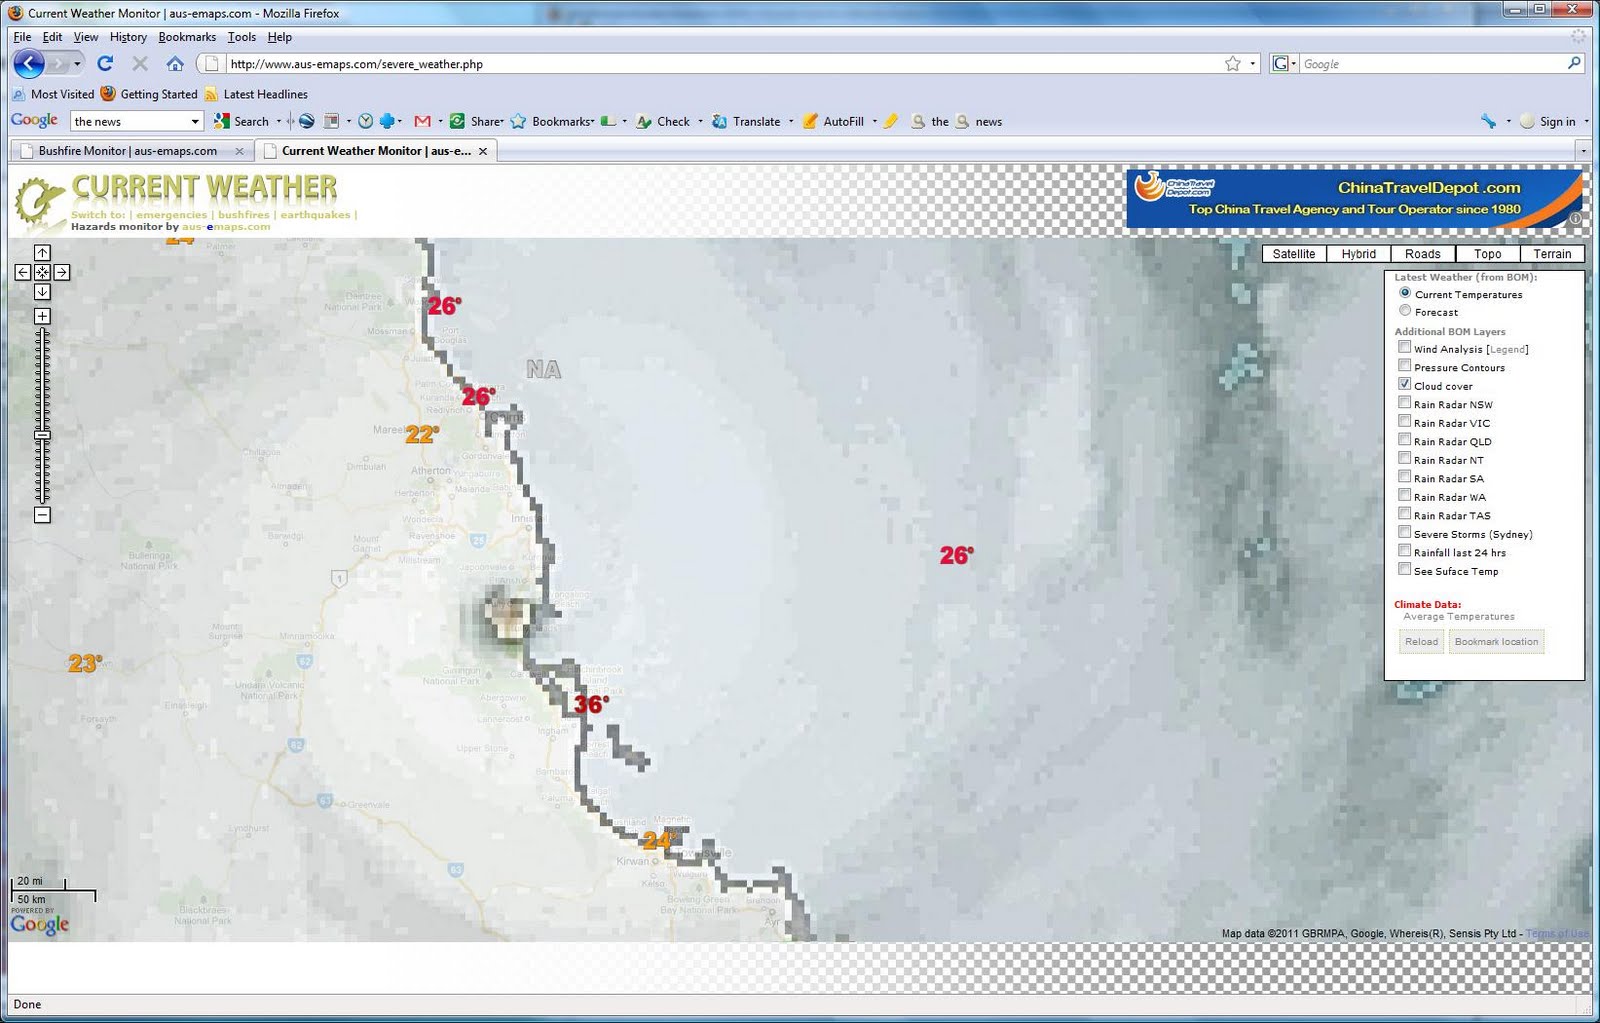
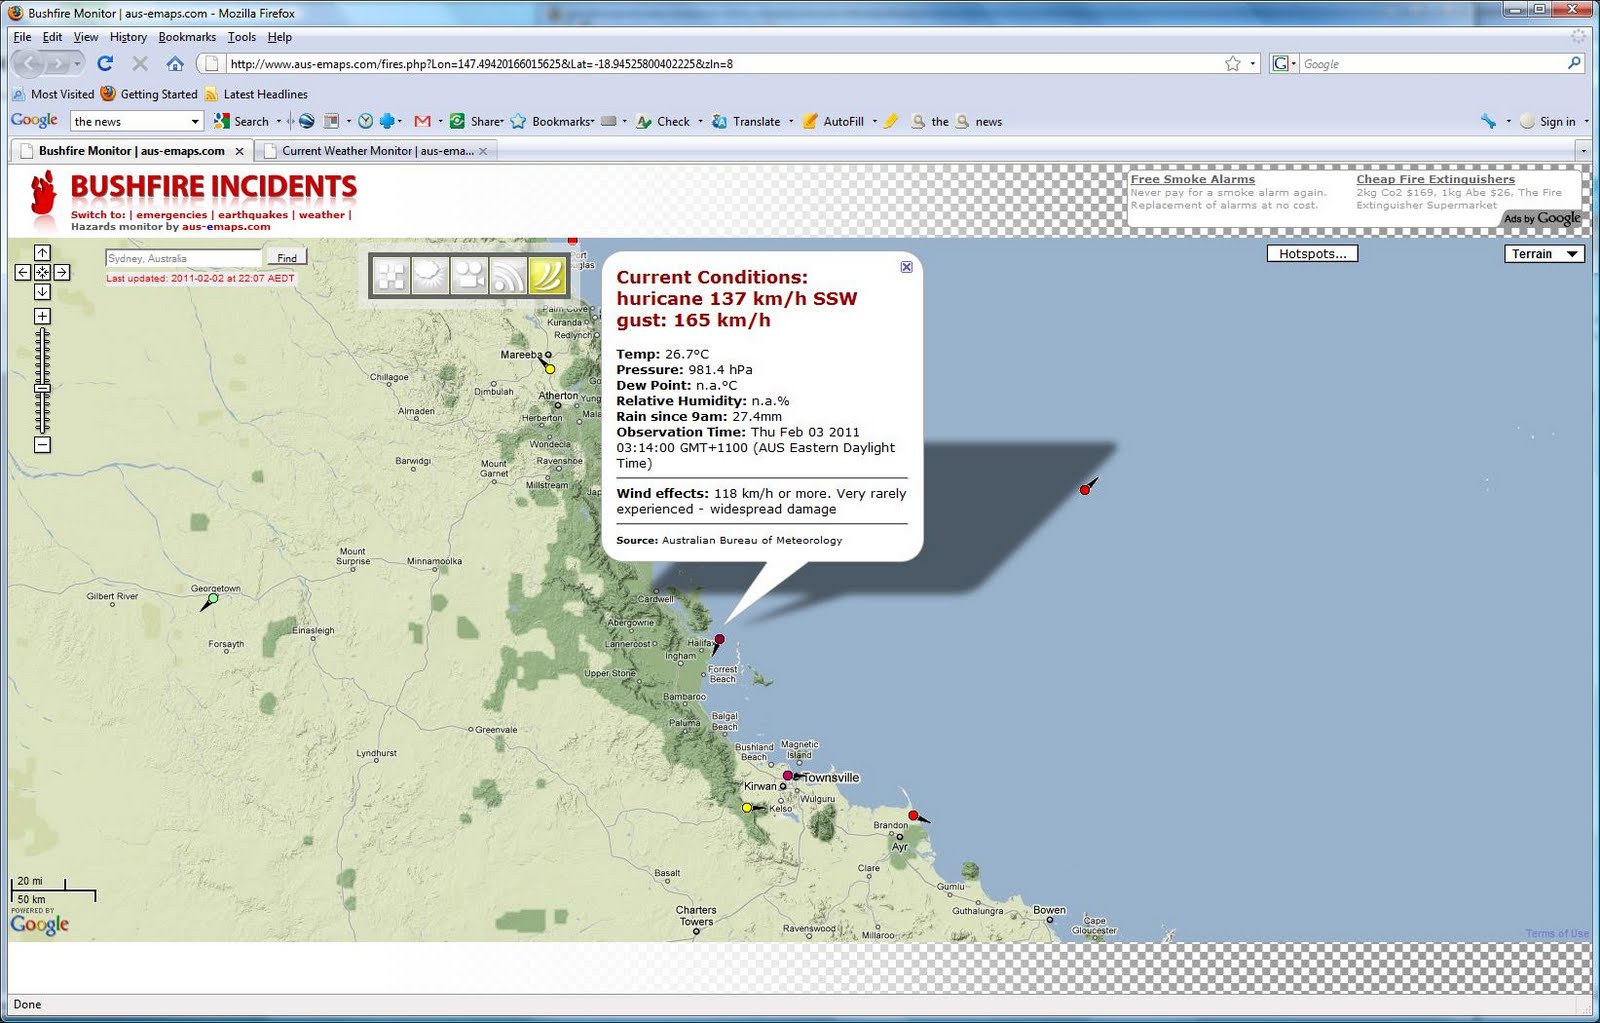
We recognise that sites may occasionally experience spikes in traffic that cause them to exceed the daily usage limits for a short period of time. For example, a media site that uses a map to illustrate a breaking news story, or a map-based data visualization that goes viral across social networks, may start to generate higher traffic volumes. In order to accommodate such bursts in popularity, we will only enforce the usage limits on sites that exceed them for 90 consecutive days. Once that criteria is met, the limits will be enforced on the site from that point onwards, and all subsequent excess usage will cause the site to incur charges.

Please be aware that Maps API applications developed by non-profit organisations, applications deemed by Google to be in the public interest, and applications based in countries where we do not support Google Checkout transactions or offer Maps API Premier are exempt from these usage limits. We will publish a process by which sites can apply for an exemption on the basis of the above criteria prior to enforcement of the limits commencing. Non-profit organizations are also encouraged to apply for a Google Earth Outreach grant, which provides all the additional benefits of a full Maps API Premier license.

Evaluating API usage by your site

To help you measure your site’s Maps API usage, we have now added the Maps API to the Google APIs Console. The Google APIs Console is a centralised dashboard for Google’s developer offerings, and we encourage all developers, no matter how big or small your application, to create an APIs Console account.

We are initially introducing the limits for Maps API v2 and Maps API v3 map loads. The Maps Image APIs, and differentiated pricing and limits for Maps API v3 Styled Maps, are not currently included in the APIs Console, but will be added in the future. Once you’ve created an APIs Console account, please follow the instructions in the Maps API documentation to enable Maps API v2 or Maps API v3 on your APIs Console Project, and update your application to provide your APIs Console key when loading the Maps API.

After updating your Maps API application, you will begin to see your usage reported in the APIs Console.


via: GoogleGeoDevelopers

The world’s longest bridge in Google Earth

The world’s longest bridge over water, connecting China’s port city of Quingdoa with an airport on the other side of Jiaozhou Bay, has finally opened. The bridge is 26.4 miles long, making it the longest bridge in the world.

The building of the bridge has generated some amazing statistics:

• It stands on 5,200 pillars.

• It cost around $1.5 billion to build.

• It uses enough steel for almost 65 Eiffel Towers – 450,000 tons, along with 81 million cubic feet of concrete.

• It can withstand a magnitude 8 earthquake, typhoons, or the impact of a 300,000 ton ship.

GEC member TomKjeldsen found the bridge in Google Earth, and added a few paths to show the bridge in the “open water” areas that don’t show anything in there.

Qingdao.jpg

To see it for yourself, you can simply use this KMZ file.

The bridge will hold its title for about 5 years; in 2016, a 30 mile bridge is expected to be completed that links Hong Kong with Macao and Guandong province.

Another disaster looming for Oz

After devastating floods in January 2011 Queensland is now bracing for the impact of category 5 cyclone Yasi. It is expected to hit Australian coast somewhere between Innisfail and Cardwell at about 11pm EST this evening, with winds over 200km/h. Emergency Management Queensland issued warnings that Yasi can cause “extensive damage and result in death or injury caused by flooding, buildings collapsing or flying debris.” The wind has already picked up to 93 km/h at Hamilton Island airport (6 pm AEDT).

Australian Bureau of Meteorology warns about “EXTREMELY DANGEROUS SEA LEVEL RISE [i.e. storm tide]… EXTREMELY DAMAGING WAVES, STRONG CURRENTS and FLOODING” as the cyclone approaches. Between Port Douglas and Ayr the winds will become DESTRUCTIVE with gusts in excess of 125 km/hr. Cyclone Yasi is expected to reach inland as far as Mt Isa.

The latest satellite image of the approaching cyclone and wind speed information for the impact area can be monitored live on aus-emaps.com’s Hazards Monitor pages (courtesy of free Bureau of Meteorology web services):

[turn on Clouds overlay to view the image, other layers are switched off]

[click wind icon in the top left corner of the map to add wind speed information layer and click/ move your mouse over the markers for details]

Updates:
[02/02/2011 at 8pm AEDT] Latest BOM update on tropical cyclone Yasi: just a crude “translation” of predicted path into kmz format for easy sharing on a map .

[03/02/2011] It is not totally over yet but media reports indicate there was no major disaster: no lives were lost and although there are many damaged houses and almost 190,000 people without electricity, overall impact of Cyclone Yasi will most likely not be as devastating as was initially anticipated. Below some pictures documenting the event, as captured by various aus-emaps.com tools.

[Yasi crossing over to land – 3am AEDT]

[Yasi location at 9pm AEDT on 02/02/20011]

[Yasi location at 11pm 02/02/2011]

[Yasi crossing over to land at about 3am AEDT 03/02/2011]

[Place of impact – very faint background but visible]

[Weather station reading near Halifax/ Ingham at the time of impact showing wind speed of 137 km/h and gusts up to 165 km/h – very high but half of what was anticipated and may explain why the damage to infrastructure was not so extensive.]