The new look of Google Maps

Hot on the heels of our new style for the Google Maps user interface, today we are pushing out some further improvements to our map design to match the updated look and feel and further improve the usability of our maps.

Amongst the changes you will find a plethora of subtle changes, designed to make the map cleaner, more focused, more visually harmonious, and easier to use. Some highlights to look out for are a brighter and more cheerful color palette, a more integrated and less visually noisy labeling style, subtle improvements to footpaths and minor roads, and cleaner building and land parcel rendering.

Most of these improvements, like many that we’ve made over the last couple of years, are gentle enough that many people won’t even notice the difference. When you add them together, however, and then compare to how the map looked even as recently as two years ago, it’s remarkable to see how dramatic the change is.

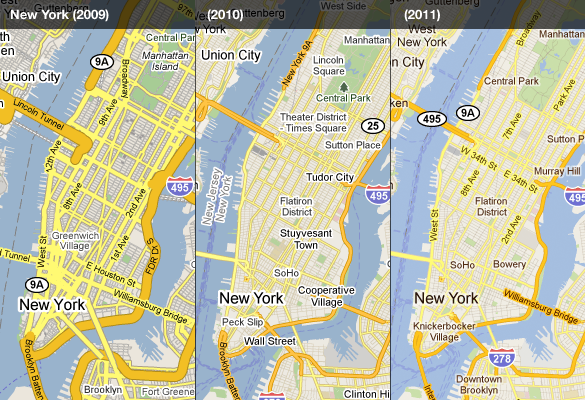
Compare how our maps of New York looked in 2009, then again the same time in 2010, and now with the new tiles for 2011. The improved colour scheme and less jarring label outlines help the labels to feel part of the map, as opposed to a distracting overlay. It’s also easier to distinguish the city name, neighborhoods, and roads through subtle changes in label color:

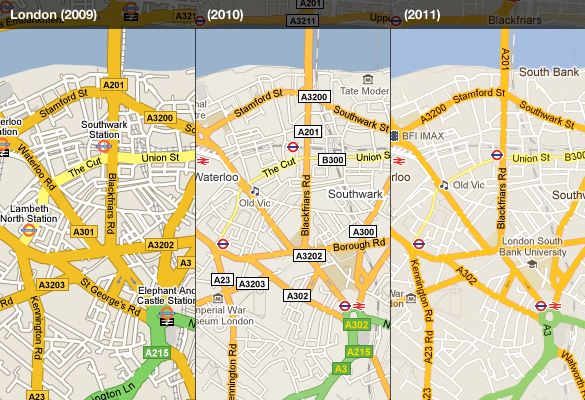
The visually heavy highway shields are now integrated into the road labels, and the brighter and cleaner style shifts the focus onto the road names and prominent landmarks in the area. London is one place that benefits from this:


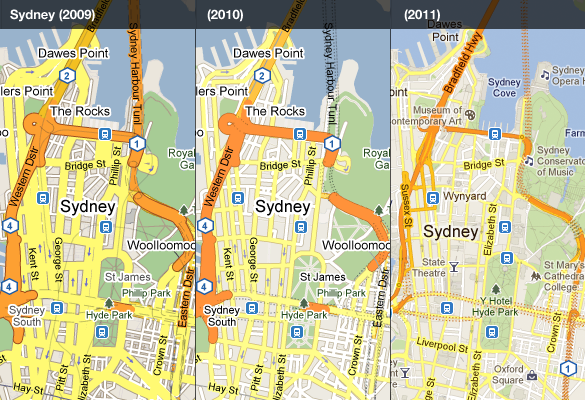
The style evolution has enabled us to place more information whilst still making the map feel simpler. In the case of Sydney, thinner and cleaner roads, better representation of tunnels, more subtle footpaths in the parks, and more subtle labeling all contribute:


We hope you enjoyed this quick retrospective and find the new improvements to the map style helpful. There are many more than have been highlighted here, so have a look around Google Maps today and see if you can spot any improvements to your local area.

Google I/O 2011: Designing Maps Applications for Usability on Mobile and Desktop

jez Fletcher and Luke Mahe Maps API applications are accessed on desktop and mobile devices of many shapes and sizes. Each application has unique goals for conveying information effectively and for facilitating user interactions

http://www.youtube.com/v/ckngV52m2Yg?f=videos&app=youtube_gdata

Google Earth Tours

Looking at the examples of GE tours out on the web I’m struck that they often use flashy attention grabbing effects but fail to communicate their content well. However, watching this video made me pause and rethink


Intangible Value: In a very entertaining talk Rory advocates the importance of ‘intangible value’: its not anything real but its absolutely worth something. An example he doesn’t discuss is the placebo effect, results show you can put a patient in an operating theatre, slice open their knee, wiggle some tools around inside achieving precisely nothing and the patient is likely to report a real reduction in knee pain after the un-operation. Amazing isn’t it?

Chart Junk: I’ve always advocated the Edward Tufte approach to graphic communication, he regards anything that is not directly contributing to communication as ‘Chart Junk’ – anything that is there to make the tour look flash or just as decoration is getting in the way of the message and should be removed. Richard Mayer has empirical evidence showing that chart junk in educational animations (which are very similar to GE tours) has a negative effect on teaching efficiency which he calls the coherence principle.
Context is All: So is chart junk fluff that should be removed or does it add a professional feel and grab attention in a useful way? My view is that in formal education (taught classes in schools or Unis) producing intangible value should be low priority, any clever effects in GE tours fail to grab attention by the 2nd or 3rd lecture of a course. However, in an outreach context, particularly in a setting like a kiosk in a museum, a GE tour would be vying for attention against other exhibits so special effects represent intangible value that is worth having. These two contexts are extreme points on the end of a scale and there are all sorts of other contexts inbetween them for which decisions need to be made. The key question in making such design decisions is ‘do I need to grab users attention?’.
Content First, Flash Presentation Second: Despite the context discussion above I would add that even in a context where flash presentation is important authors need to be careful that the message still gets through. Its no use grabbing someones attention if you fail to then do anything with the time they then give you. Juggling this need to both attract attention and also tell a good story is not easy but Hallway Testing is the solution.