2011 — The Year Python Takes Over GIS

Funny how we think back to the past and say things like “the world was a simpler place back then”. I was sitting having some beers with a couple long time GIS friends and one of them started going off on how much better his life was back with ArcInfo and AML[1]. We went though the workflows back then; ArcEdit, ArcPlot[2] and the rest. Removing the specific programs from the work flow, we are left with one clear point of GIS analysis in 1997, scripting.

Back then, if you needed to convert a file, re-project it, buffer it and then clip it, build it or clean it; you did it all within one text file (usually ending with .aml). There wasn’t any one off GUI wizard that you ran, you planned out what you wanted to do, authored a AML script, ran it and then took some time out for a cup of coffee. That seems to have been lost and probably because AML was essentially deprecated the minute ArcGIS 8 arrived.

But in 2011 we have a great scripting language that no only can replicate those AML workflows of the past, but bring in new tools that can help get our work done faster. That would be Python. There is no reason why, right now, you shouldn’t close out your ArcGIS Toolbox window and start using ArcPy.

import arcpy

from arcpy import env

env.workspace = "c:/workspace"

# variables
in_features = "soils.shp"

clip_features = "study_boundary.shp"

out_feature_class = "c:/workspace/output/study_area_soils.shp"

xy_tolerance = ""

# Execute Clip

arcpy.Clip_analysis(in_features, clip_features,
out_feature_class, xy_tolerance)

Shoot that is easy, isn’t it? It all works that way and the ArcGIS help includes all you need to copy and paste to start using python for your analysis at the bottom of each help article. Plus if you are “that guy” who remembers ArcPlot fondly, there is a whole ArcPy Mapping Module that gives you all that power to manipulate MXD and LYR files using Python.

Remember AML fondly if you must, but today with Python you have tools that run circles around what AML gave you. I find myself opening up a command window and running python commands to manipulate data over starting up ArcCatalog these days and I love it.

No more excuses to not use Python.


[1]: Don’t we all have one of these friends, the one who thinks that AML and Avenue were the high point of their GIS existence.
[2]: Actually there is no reason to fondly recall ArcPlot. I hope it does a slow painful death on some HP-UX server in a hot room in the sky.
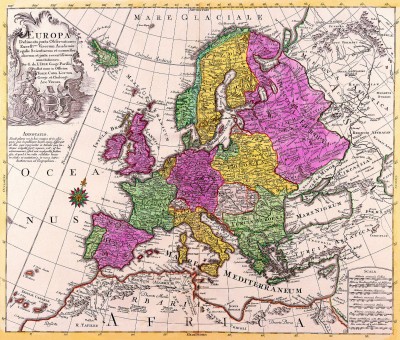
The Art of Maps: Europa Delineata juxta Obfervationes Excellorum – Vindel 1760

“Europa”

“Delineata juxta Obfervationes Excellorum Virorum Academiae Regalis Scientiarum et nonnullor aliorum et juxta recentifsimas annotationes”, “Per G. de L’Isle Geogr.Parifilis. Proftat nune in Offieina Tobiae Conr.Lotter, Geogr. et Chalcogr. Aug: Vindel”     1760

Map locations: Mare Glaciale, Moscovia Asiatica, Moscovia Europaa, Polonia, Hungaria, Turcia Europaea, Germania, Gallia, Suecia, Norvegia, Scotia, Anglia, Turcia Asiatica, Moldavia, Romania, Italia, Hispa, Portugallia, Regnum Algerium, I.Malta I.Cyprus, Insulae Canariae, I.Madera and others.

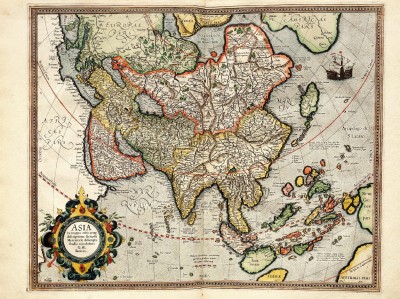
The Art of Maps: Map of Asia from Atlas sive Cosmographicae by Gerardus Mercator (1595)

Atlas sive Cosmographicae by Gerardus Mercator (1595)

The Fleming Gerard Mercator (1512-1594) is rightfully regarded as the most important scientific cartographer of the Renaissance. With two contemporaries, the geographer Abraham Ortelius and the printer and publisher Christoffel Plantijn,he is considered the father of commercial cartography in the Netherlands.Even during his lifetime his maps, globes and atlases found their way all over the world.Mercator established his reputation mainly through his new projection method. The meridians and parallels are positioned at right angles to each other.If the distances between the meridians are equal, they progressively become larger between the parallels from the equator to the poles.This is why the latitude becomes wider the closer you get to one of the poles and why the part of the Earth in the upper latitudes exhibits excessive proportions.The advantage of this method was the far greater degree of certainty and accuracy in determining shipping routes.In 1585, Mercator published the first three parts of his own book of maps in one volume,which he called Atlas.The second edition appeared in 1589, with the addition of a fourth part. The first complete edition was compiled by his heirs in 1595 one year after his death.Walter Ghim,mayor of Duisburg the city where Mercator had lived for a long time,wrote the accompanying Mercator biography.It was the first time that a book of maps was referred to as an Atlas.Commercially speaking,however,the Atlas was not a success thanks to formidable competition from the Theatrum orbis terrarum by Abraham Ortelius,published in 1570,which by the end of the century had been reprinted more than twenty times.

The Art Of Maps:

The Art of Maps: Map of America from Atlas sive Cosmographicae by Gerardus Mercator (1595)
The Art of Maps: Europa Delineata juxta Obfervationes Excellorum – Vindel 1760
The Art of Maps: PIRI REIS MAP
The Art of Maps: Map of Europe from Atlas sive Cosmographicae by Gerardus Mercator (1595)
The Art of maps: John Speed: Asia with the Islands adioyning described, the atire of the people, & Townes of importance, all of them newly augmented . . . 1626
The Art of Maps:Johann Baptiste Homann [California as an Island]
The Art of maps:Matthias Quad – Map of North America 1593
The Art of Maps: Americae Nova Tabula
Sightseeing Map Locations Bulgaria
The Art of Maps: CORNELIS DANCKERTS Nieuw Aerdsch Pley MAP