Ozone levels dropped by as much as half in the past year

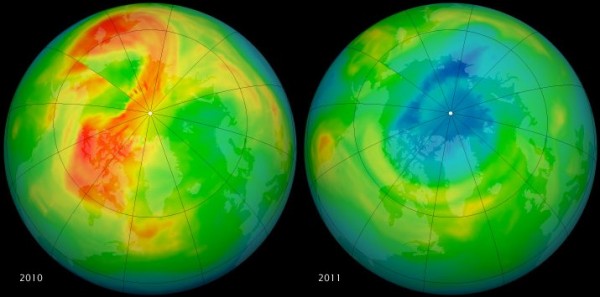
Check out the stark difference between these two satellite images, taken on March 19, 2010 and March 19, 2011. The left image shows much more ozone (in red) over the Arctic than the right image. What’s happened?

These maps come from NASA’s Ozone Monitoring Instrument (OMI), aboard the Aura satellite. The two images tell a stark tale of rapid ozone depletion. OMI uses a spectrometer that measures the amount of sunlight scattered by Earth’s atmosphere and surface, which gives a sense of how much ozone exists at different levels, including the stratosphere.

Here’s an animation which shows the dynamics of the ozone layer from January 1 to March 23 in both 2010 and 2011:

In mid-March, scientists from the Alfred Wegener Institute reported that Arctic ozone levels had been cut in half towards the end of winter, based on data from 30 ozone-sounding stations around the region.

The good news is, Arctic ozone levels fluctuate from year to year, and ozone “holes” don’t form as consistently as they do in the Antarctic. It remains to be seen whether this ozone depletion will actually lead to increases in the intensity of ultraviolet radiation in the Arctic. Says Paul Newman with NASA’s Goddard Space Flight Center, “We need to wait and see if this will actually happen… It’s something to look at but it is not catastrophic.”

But still, the question of why ozone levels dropped so starkly this year remains, and nobody has a good answer. There are still a lot of ozone-depleting chemicals like CFCs in the atmosphere, despite their regulation by the Montreal Protocol. It’ll take a long time for the concentration of these chlorines to decline, because these chemicals have a long lifespan. And the process of ozone depletion is intensified when the stratosphere is especially cold, which has been the case in recent weeks.

Says Newman:

Last winter, we had very high lower stratospheric temperatures and ozone levels were very high; this year is just the opposite. The real question is: Why is this year so dynamically quiet and cold in the stratosphere? That’s a big question with no good answer.
Google API Talks – Android, KML,Google Maps,Gadgets/Mapplets

At the beginning of the April Silicon Valley GTUG meeting, several Googlers and external developers gave lightning talks about their latest and greatest. Watch Dick Wall talk about Android updates, Van Riper talk about his KML, Tom Brown display transit data visualization in Google Earth, Brian Hamlin show off animated weather KML, the Seero guys demonstrate their live video mapping site, Mano Marks introduce libKML, and Pamela Fox talk about Google Gadgets and Mapplets.

SketchUp Pro Case Study: Dan Tyree

Dan Tyree is an extremely prolific home designer who uses Sketchup Pro with LayOut for his presentations and documentation. He’s designed homes throughout the world. Dan writes:

I started using CAD products when they were still running on a DOS platform; I spent many years using expensive programs, but still struggled to find a good way to present in 3D for my clients. I started using Sketchup Pro as a solution for presentations, and used the DWG exporters to continue the drawings in CAD. I quickly realized that LayOut would allow me to completely eliminate my CAD program—I could create construction documents directly from the presentation model.

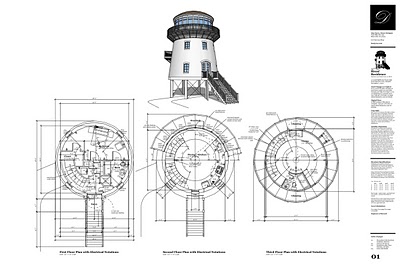
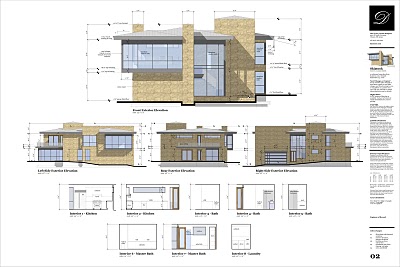
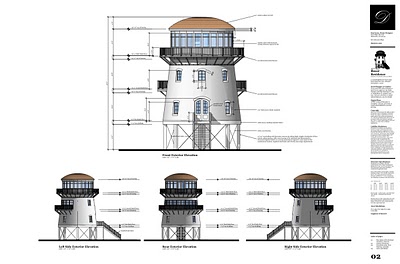
The Reese Residence designed in SketchUp and presented in LayOut

We use Sketchup and LayOut to create amazing presentations for our clients. We are able to show the design in rendered views or immersive videos. Clients are able to picture what the final product will be in vivid detail. We provide the SketchUp file to clients so they can experiment with colors, or just browse through their new home design. We post images and videos of the design on the client’s page (on our website) for their review.


LayOut provides everything we need to create construction documents.

Next, we take the SketchUp model and link it to a LayOut document in order to start developing the construction drawings. These drawings include full-color renderings and perspective views, as well as traditional black and white parallel projections. The interaction between the two products allows us to offer changes throughout the process, even right up to the moment of final printing.

“Skiatook”, presented in LayOut

PDF and CAD files are exported from LayOut. These are made available for our clients to download from our website. SketchUp and LayOut have made presenting a design and creating construction drawings a streamlined process, and have allowed us to provide an affordable custom design product.