How maps can improve sales

There is a saying “Half the money spent on advertising is wasted; the trouble is you don’t know which half.” The statement attributed to John Wanamaker, who is considered to be the father of modern advertising, illustrates how difficult it is for a business to come up with an optimal advertising strategy that will deliver maximum results, at the minimum cost, and with minimum wastage.

If you try using “a bit of everything” you are spreading your resources too thinly. Focus too much on a single advertising channel and you are potentially missing out on some big opportunities elsewhere.

For example, online social media engagement for promotion of business is the latest communication channel rapidly gaining in popularity (and hype) but should it be the only channel? Will it deliver in your line of business and for your geographic market? It’s one of those dilemmas: “damn if you don’t engage, damn if you do…” so, one way of prioritising which advertising and promotional options to pursue is to compare alternatives based on total reach, proportion of target population reachable through the channel, duration and timing of exposure, and overall costs involved.

Although the optimal mix of advertising and promotional activities will depend on what you are selling, the target audience you are pursuing (ie. whether global or local) and the scale of you operations, however there is one simple activity that should always be seriously considered – contacting your potential clients directly (either cold calling, sending snail-mail or just arranging for letterbox drops). Why? Because of simplicity of implementation of this option. And not to mention that the campaign can be personalised, can be localised (either for testing or to stage a rollout if your budget or response handling capacity is limited), you can easily measure the results and it can be very inexpensive.

The rest of this article is a case study on how maps and simple spatial analysis techniques can improve efficiency of direct marketing activities and ultimately, sales results. Traditionally, such methods have been restricted to only large companies due to the cost of analytical tools and/or specific skill set required to undertake the analysis. However, with the advent of free mapping solutions and increasing volumes of free data liberated by State and Federal governments with Creative Commons licensing, the capability to undertake spatial analysis is well within reach of business enterprises of any size.

Case Study

Challenge: Your target market is property investors in Canberra and you have a budget for a letterbox drop of promotional materials about investment loan refinancing options to 10,000 prospects. Your objective is to maximise effectiveness of the campaign (ie. get the best return on your bucks!).

Solution: The key to the success of your campaign is to know which are the areas that offer the best opportunity to reach your target audience. The easiest way out would be just to pick the most affluent postcodes and do your mailbox drops there. But is this the optimal approach? And which are those “affluent postcodes’?

There is a good range of free information available from the Australian Bureau of Statistics that could help with the campaign but for this particular campaign there is even better free data source: statistics on personal returns from the Australian Taxation Office that show numbers of property investors in each postcode.

Equipped with that data you can do a simple analysis classifying and sorting the postcodes based on a couple of variables: overall proportions of people claiming rental investment expenses in each postcode and the value of their claims in relation to the ACT average. This will allow to pinpoint specific postcodes with the highest probability of reaching the target audience (ie. the highest proportion of taxpayers claiming the highest loses).

Focusing just on the postcodes with the largest number of property investors is not the most optimal approach since population counts in each postcode vary dramatically. So, the absolute number of investors in a given postcode may be high but proportionally to the overall number of people in that postcode, there may not be many prospects there. And besides, you would also want to find people with the largest mortgages to optimise your efforts. Therefore, that extra analytical step can be very beneficial. This way it is possible to derive a meaningful ranking measure of postcodes based on the concentration of people with sought after characteristics in each postcode.

Mapping the results will help to visualise the location of your target audience and to manage distribution of promotional materials. Thematic map shown below is an illustration of the outcome of a simple analysis outlined above and shows detailed boundaries of target postal areas (dark red polygons indicate areas with highest concentration of target audience).

[full report can be downloaded for free from: aus-emaps.com/reports/ ]

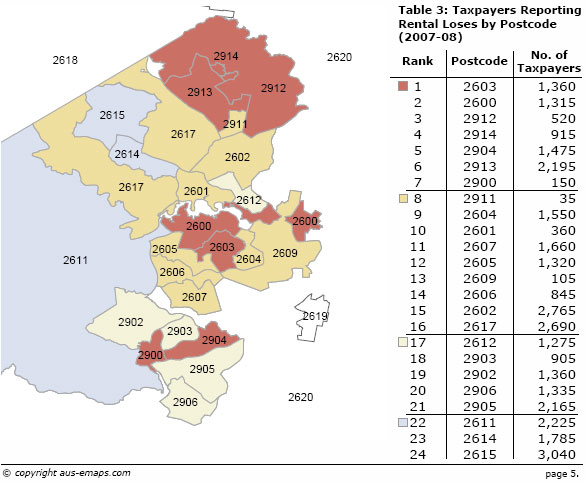
Conclusion: The campaign should focus on postcodes 2600 and 2603 (with approximate number of 10,500 taxpayers and 2,675 total potential clients). Targeting these postcodes will give you the most optimal, 1 in 4 chance, to reach your audience.

This case study demonstrates that running campaigns in an ad hoc manner cannot deliver optimised outcomes. Even if you have limited resources, simple analysis and mapping of the results can help immensely in maximising the return on your efforts.

Another natural disaster tragedy in Oz

I have just heard the news about flash flooding in Toowoomba and Lockyer Valley, Queensland. In this latest incident eight people died and so far over 70 are missing. Death toll is expected to rise. My heart goes out to all that have lost loved ones in this tragedy.
The overall death toll from floods in NSW and QLD in November 2010 to January 2011 is much higher but statistics are not readily available. As usual, after the clean up is finished questions will be asked: “Was this tragedy preventable?”. Then millions will be poured into a solution “…to prepare us for the next time”, as was the case with all previous disasters. So now Australia has a few hundred million dollar tsunami detection and early warning system to prepare us for another one-in-100-years event. As a result of Victorian bushfires we also have a multi million dollar monitoring and alert system (including phone messaging alerts) for bushfires. Flood warning system will be the next…
Why it always takes a tragedy to motivate governments to do something to improve safety of its citizens? The money is then no objective to find a better approach/ solution… Why can’t there be a proactive rather than reactive approach to disaster mitigation?

What I am about to say is not intended a as a criticism of authorities, rather just a statement of facts. Yes, it is obvious that a bit more proactive approach would save lives but the reality is that it is very difficult for authorities, whether State or Federal to do things proactively. Most often then not, priorities of the day take precedence (just read news headlines and it will become clear what this priority is on any given day). It takes lots of resources and time to get major projects off the ground, then administer them towards a particular outcome. Therefore, there must be a catalyst, a disaster if you like, to shake things up and get politicians to “find” those millions to put policies in place to prevent another similar tragedy.
Don’t get me wrong, not that there are no continuous improvements to current disaster mitigation programs, but still, it takes a disaster to focus the attention of decision makers on things that “should have been done in the first place”… Again, the reality is that Departments and agencies can only work on projects within their allocated range of responsibilities and currently allocated tasks, and money. All in all, it is very difficult for pubic service institutions operating in our existing governance structures to do things proactively, without aligning to specific agendas of the government of the day…

So, who else is there to look after the interests of individual citizens? I believe that community at large should accept part of the responsibility for looking after its own affairs. Even without huge financial resources public initiatives can make enormous impact. And with respect to prevention of disasters, communities can assist or complement things put in place with government funded programs. But there have to be a widespread commitment for things to work…

Just consider a few examples of community lead projects in GIS arena like, for example, OpenStreetMap community response to 2010 Haiti earthquake or Ushahidi community engagement after Haiti and Chile earthquakes. Australia has its own suite of natural disaster focused applications, either community based or maintained by enthusiasts. For example, ABC has just released ABC Qld Flood Crisis Map, built on Ushahidi platform, for crowdsourcing reports on Queensland floods and recovery operations. BushfireConnect is another community lead Ushahidi deployment for corwdsourcing reports on bushfires. Ushahidi platform can be configures to send SMS alerts to registered users. My own Hazards Monitor is yet another example of a private initiative to monitor and report on natural disasters.


There is also The Australian Early Warning Network that republishes Bureau of Meteorology information and sends emergency alerts to mobile phones, home phones, pagers and via SMS or e-mail. It is maintained by a private company.


Lucky for Australia, the disasters are few and far between. But this is exactly what makes proactive investment in natural hazards monitoring and disaster response systems, whether government sponsored or community lead, so difficult. Interest in those systems diminishes as quickly as the tragedy disappears from news headlines. It is so hard to keep politicians and community engaged and supportive for the initiatives when there is no threat present. So, in the end, it is always up to a bunch of committed individuals who work on solutions proactively, and despite all the odds, in anticipation that their effort one day may save a life. Sad reality… So, paraphrasing JF Kennedy: “…ask not what your country can do for you – ask what you can do for your country…” to limit the outcome of natural disasters in the future!

Free map service preview

I am rushing the release of my latest free service offering from aus-emaps.com due to high level of interest in accessing postcode and other administrative boundaries data on a reference map that can be dynamically called from external sites. At this stage the free map service is more like a preview release rather than the real thing but it is good enough for a “show and tell”. The full concept behind this service is rather a long story so I will leave it for a more appropriate occasion. For now I will just limit the description to a short statement that it is intended as a free reference map, for embedding into website or linking to, to share location specific information.

Currently it works only with kmz files that can be referenced from anywhere on the world wide web and postcode boundaries from aus-emaps.com. It accepts single and multiple kmz files, as per examples below.

Here are a couple of examples of kmz files with complex information: in this case, Victorian bushfires aftermath (public file extracted from Google MyMaps): http://www.aus-emaps.com/svs/ref/map.php?
kmzl=http://www.aus-emaps.com/data/VictorianBushfiresFeb2009.kmz

And here is an example of kmz file showing the latest world earthquakes from USGS: http://www.aus-emaps.com/svs/ref/map.php?
kmzl=http://earthquake.usgs.gov/earthquakes/catalogs/eqs7day-age.kmz

Finally, a simple example of referencing Australian postal boundaries map from aus-emaps.com:
http://www.aus-emaps.com/svs/ref/map.php?
kmzl=2601,2220,7000,3122,5000&svs=2,2,2,2,2

Width and height of the map can be easily controlled by adding the following parameter to the URL: &wh=500,400 (size in pixels). Map type selection is with &mt=0 parameter (valid numbers are 0 for street map, 1 for satellite overlay, 2 for hybrid map and 3 for terrain map). This is just a quick demo of basic capabilities to give you a taste of what is possible with a very basic deployment of Google Map API (this one is still running only on version 2). More on this service soon.