There is an old adage that the three most important rules for selecting a property for purchase are: location, location, location. So, maps should be one of the primary tools in making the purchase decision. With the advent of Google Maps, Bing Maps and plethora of other online mapping applications, all real estate portals integrated mapping based search options into their websites. However, mapping applications presenting analytical information on the state of the property market in various parts of the country are only starting to be brought to life.
Property Investment Map on domain.com.au is the first analytical map released by the major Australian real estate portal. It contains a set of thematic overlays presenting information on gross rental yields, capital gains, vendor discounts and top performing areas – by suburb, for the entire Australia (excluding ACT). Information is available separately for houses and units, as 1 year or 5 year trend measures.
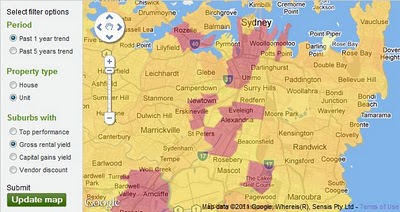
Property Investment Map provides invaluable insights into the dynamics of the property market on a local scale. For example, using the map investors can pinpoint suburbs with good rental yields and capital growth prospects. These areas are the most desirable for investors as high rental yields imply attractiveness of the location to renters as well as availability of properties at prices still offering good value. At the same time, high capital gains yields over short as well as longer term imply consistency in appreciation of properties in a given area over time. Eastlakes in central Sydney is one suburb displaying such characteristics in relation to units -median price increased 17% in 2010 and further rise of 3% is predicted for 2011.
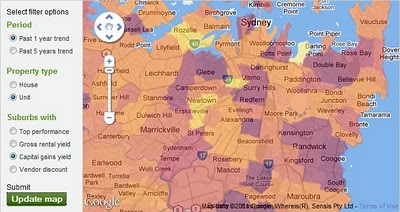
Totally different market dynamics can be demonstrated on example of Rozelle, a suburb just west of the CBD. Despite showing high gross rental yield for units in the last year, it has relatively low rates of capital gains over one as well as 5 year period. It could imply this suburb was overpriced in the past and only now rental yields for units have increased to the level that makes them attractive again for investment purposes (median price dropped 4% in 2010 and prediction for 2011 is 0% growth). If history is to repeat, there is a good chance prices could overshoot again if Rozelle is suddenly “rediscovered” by investors. Property Investment Map cannot give all the answers so, the picture would have to be validated with local knowledge before making any decisions.
Property Investment Map should be in the toolbox of not only investors but also anyone serious about purchasing a property. The only limitation of the map is lack of details on how the information was derived (eg. methodology for data range determination). It is a good starting point for deciding on alternative locations for investment, although it would also be nice to have a numerical version of the dataset available for more detailed comparisons.
 The task of finding the right supplier is never easy, especially when services are concerned. Industry specific directories can be a good starting point for preselecting potential candidates for contact and further evaluation. SpatialSource.com.au is the leading portal for the Australian spatial industry. It publishes a directory of suppliers of “all things spatial”. There are over 200 providers listed in a variety of categories, divided into five main groups: Data Supply, Geospatial Services, Hardware Supply, Services to Spatial Industry and Software Supply – from top tier multinationals to small operators like aus–emaps.com. Bookmark the following link for your future reference: http://directory.spatialsource.com.au/