Fusion Tables is ready to blow

Google is making consistent but slow progress with Fusion Tables, gradually enabling various functionality options to turn the application into a comprehensive data visualisation and sharing package. The idea behind Fusion Tables is simple – allow people to upload data in a tabular format, then present that data with graphs or geocode/ match to spatial data and display on Google maps as thematic overlays or location points. Undoubtedly, the integration of tables, maps and graphs is Google’s response to emerging trend for “data marts” and “data journalism”.

Fusion Tables has a potential to evolve into a formidable competitor to PostGIS, ArcSDE , Oracle Spatial or SQL Server for basic GIS applications. Although a recent addition of dynamic styling capabilities takes Fusion Tables closer to that goal, it is still a long way for the application to reach that point. Unfortunately, the implementation of Fusion Tables is in typical, of late, Google fashion – unattractive and rather complex to follow so, most likely only “hard core” developer community will be taking advantage of it. The limit of 250MB of data per account is not helping either. There is no catalogue of available data (although basic text search is enabled) and no metadata for public tables so, it will not facilitate sharing.

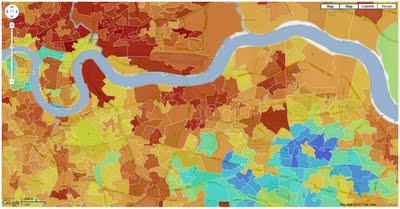
Nevertheless, you can already make nice and very responsive maps with Fusion Tables, as in this example from Guardian’s Data Blog:

Visualizing your location based data with Fusion Tables

Google Fusion Tables is a modern data management and publishing web application that makes it easy to host, manage, collaborate on, visualize, and publish data tables online. Fusion Tables allows for import of geospatial data to quickly and easily display that data on a Google Map.


The Fusion Tables team has been working hard to enrich what Fusion Tables offers for customization and control of the Google Map visualizations. Two very exciting announcements were made at Google I/O during the Fusion Tables session on Managing and visualizing your geospatial data with Fusion Tables. These announcements include the release of the Info Window and Styling in the Fusion Tables API and Fusion Table Styling in the Google Maps API. 


Info Window and Styling API

Previously, map styles and info window templates could only be customized via the Fusion Tables UI. The Info Window and Styling API opens up this functionality to the Fusion Tables API as well. There are many benefits of having API access to map styles and info window templates. For example:

  • This saves time when customizing hundreds of tables.
  • Since the styles and templates are JSON objects, it’s easy to serialize the objects and reuse them later.
  • The styles of public tables can be discovered and used for your own tables.

The Info Window and Styling API is still accepting Trusted Testers! If you’re interested in becoming a Trusted Tester, please join the Fusion Tables API Trusted Tester Google Group.

Fusion Tables Styles in the Google Maps API

Fusion Tables Styles further increases the possibilities of map customization. Rather than applying a style to a table via the API or UI, styling can now be introduced on the client side using the Google Maps API. There are many benefits to Fusion Tables Styles:

  • It allows for dynamic styling of map features.
  • It’s opens up the possibility for styling tables with multiple attributes.
  • You can give your users the opportunity to decide what range of styles works best for your data.
  • Third party developers can now generate visualizations of your data that differ from your own, which makes sharing your data more powerful and useful.

Fusion Tables styles are available now! Read more about how to use Fusion Tables Styles in the Fusion Tables Layer section of the Google Maps API documentation.

We’re already seeing some really nice uses of Fusion Tables for map customization. Simon Rogers, who joined us for the Fusion Tables I/O session to talk about how the UK Guardian Datablog uses Fusion Tables, has been making great use of Fusion Tables Styles. Here’s one of the Guardian’s latest examples. If you’re interested in creating a map similar to the Guardian’s, we have developed a template for plug-and-play.

What’s new since I/O?

Ever since I/O, we’ve been working to bring you new and interesting additions to the API. For example, this past month, we added IN to the list of supported column filters.


All the Pizza Places In Manhattan with Fusion Tables

Thanks to Jeff Manheimer for making this map. I have been dreaming of doing something like this for ages, but I’ve been too lazy. If it weren’t for motivated people like him, nothing would ever get done in the world.

It looks better non-embedded so if you wanna see it HUGE, click this link.